fastplot
Weather maps and scientific plots with the matplotlib and cartopy interface, rendered directly to pixels by numba on every CPU core or by CUDA on an NVIDIA GPU.
Overview
fastplot implements the parts of matplotlib, cartopy and MetPy's plotting that weather and climate work depends on: maps of gridded fields, line and bar charts, Skew-T diagrams, hodographs, polar plots and triangulations. Scripts written for those libraries usually run after changing their imports, and the figures keep the same layout, colours, ticks and fonts.
Most of matplotlib's drawing time goes into building Python objects for every artist and, with cartopy, reprojecting every polygon through shapely. fastplot skips both. Each pixel of a map looks up its own value in the grid, lines are drawn in parallel tiles, and the PNG is compressed on every core. The performance page has the measurements.
Example
import fastplot.pyplot as plt
import fastplot.crs as ccrs

fig = plt.figure(figsize=(11, 6.2), dpi=150)
ax = fig.add_subplot(
    projection=ccrs.Robinson(central_longitude=-150))
pc = ccrs.PlateCarree()

cf = ax.contourf(lon, lat, t2m, levels=range(-44, 45, 2),
                 cmap='RdYlBu_r', extend='both', transform=pc)
ax.contour(lon, lat, t2m, levels=[0], colors='#1f3a93',
           transform=pc)
ax.coastlines(linewidth=0.5)
ax.set_global()
fig.colorbar(cf, ax=ax, orientation='horizontal',
             shrink=0.6, label='Temperature at 2 m (°C)')
fig.savefig('t2m.png', bbox_inches='tight')
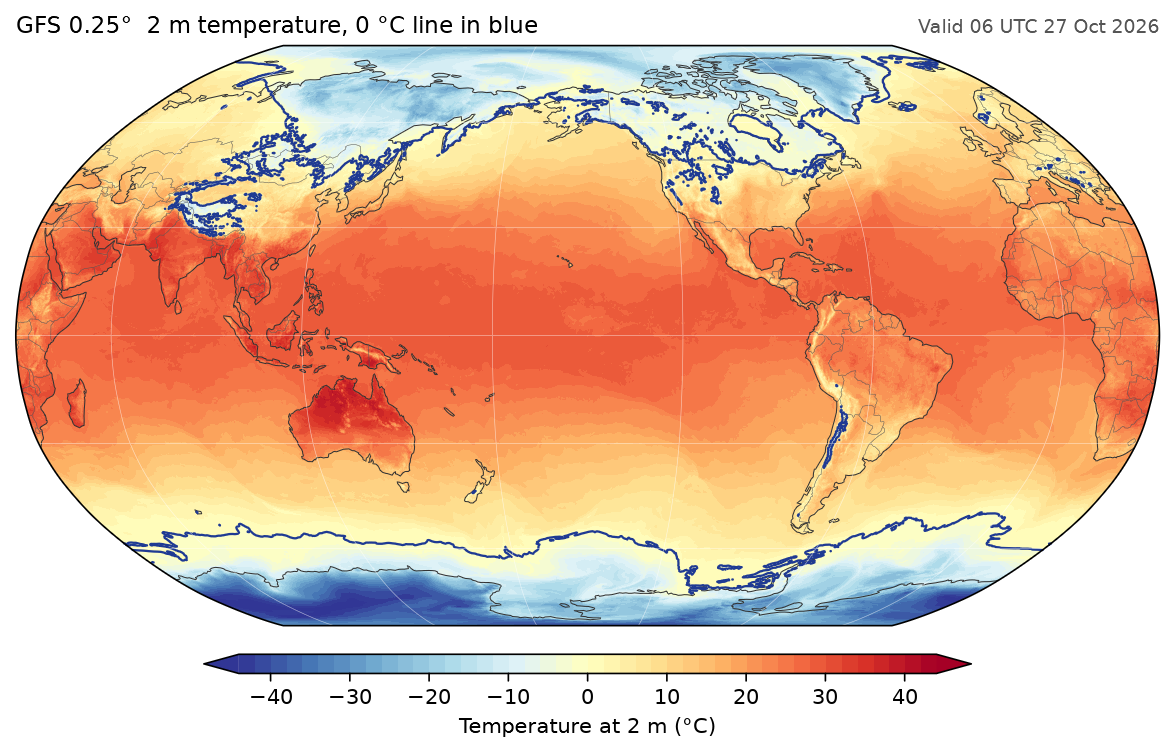
The full script, which reads the GFS field with fastgrib, is docs/examples/global_temperature.py.
Scope
| Area | What is there |
|---|---|
| Maps | Twelve projections, pcolormesh, contourf, contour, clabel, barbs, quiver, streamlines, Natural Earth features, labelled gridlines |
| Plots | Lines, scatter, bars, histograms, fills, error bars, log, symlog and date axes, twin and shared axes, legends, annotations, patches, polar axes, triangulations |
| Meteorology | MetPy's SkewT and Hodograph, with dry and moist adiabats |
| Style | rcParams, matplotlib's style sheets, every built-in colormap and norm |
| Output | PNG, JPEG and WebP, or an RGBA array; the same image on CPU and GPU |
fastplot does not cover all of matplotlib. There are no 3-D axes, and PDF and SVG files contain the rendered image rather than vector paths. The differences page lists what behaves differently.
fastplot is developed alongside fastgrib, which decodes GRIB files into numpy arrays at a similar speed.