Wind rose
Every hourly wind observation at Amarillo, Texas in 2025, binned by direction and speed and drawn as stacked bars on polar axes.
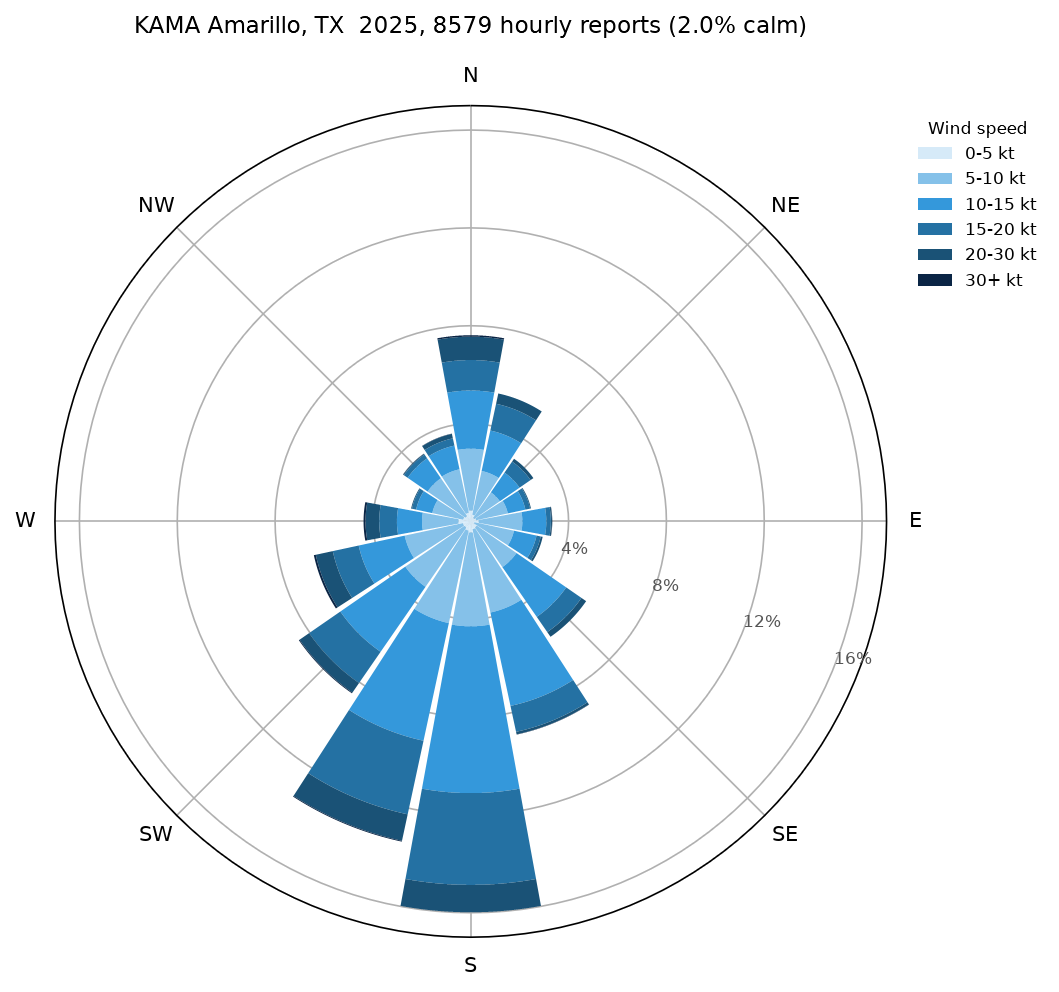
Data: Iowa Environmental Mesonet ASOS archive, saved in docs/examples/data/asos_AMA_2025.csv.
docs/examples/wind_rose.py
"""A wind rose for Amarillo, Texas: every hourly observation of 2025, binned
by the direction the wind blew from and its speed. Data from the Iowa
Environmental Mesonet's ASOS archive."""
import os

import numpy as np

import fastplot.pyplot as plt

HERE = os.path.dirname(os.path.abspath(__file__))
obs = np.genfromtxt(os.path.join(HERE, 'data', 'asos_AMA_2025.csv'), delimiter=',', names=True,
                    dtype=None, encoding='utf-8', missing_values='', filling_values=np.nan)
ok = np.isfinite(obs['sknt']) & np.isfinite(obs['drct'])
speed, direction = obs['sknt'][ok], obs['drct'][ok]
moving = speed > 0                                    # calm reports have no direction
n = speed.size

sectors = 16
width = 2 * np.pi / sectors
centre = np.arange(sectors) * 360 / sectors
which = np.round(direction / (360 / sectors)).astype(int) % sectors
bins = [(0, 5), (5, 10), (10, 15), (15, 20), (20, 30), (30, np.inf)]
colours = ['#d6eaf8', '#85c1e9', '#3498db', '#2471a3', '#1a5276', '#0b2545']

fig = plt.figure(figsize=(8.4, 7.2), dpi=150)
ax = fig.add_subplot(projection='polar')
ax.set_theta_zero_location('N')
ax.set_theta_direction(-1)
ax.set_axisbelow(True)

bottom = np.zeros(sectors)
for (lo, hi), colour in zip(bins, colours):
    sel = moving & (speed >= lo) & (speed < hi)
    share = np.bincount(which[sel], minlength=sectors) / n * 100
    label = '%d+ kt' % lo if np.isinf(hi) else '%d-%d kt' % (lo, hi)
    ax.bar(np.radians(centre), share, width=width * 0.92, bottom=bottom, color=colour,
           label=label)
    bottom += share

ax.set_thetagrids(range(0, 360, 45), ['N', 'NE', 'E', 'SE', 'S', 'SW', 'W', 'NW'])
ax.set_rlabel_position(112)
top = np.ceil(bottom.max() / 4) * 4
ax.set_rgrids(np.arange(4, top + 1, 4), ['%d%%' % v for v in np.arange(4, top + 1, 4)],
              fontsize=8, color='#555555')
ax.set_ylim(0, top + 1)
ax.legend(loc='upper left', bbox_to_anchor=(1.02, 1.0), fontsize=8, frameon=False,
          title='Wind speed', title_fontsize=8)
ax.set_title('KAMA Amarillo, TX  2025, %d hourly reports (%.1f%% calm)'
             % (n, 100 * (~moving).mean()), fontsize=11, pad=16)

fig.savefig(os.path.join(HERE, '..', 'images', 'wind_rose.png'), bbox_inches='tight')