Rotation tracks and tornado paths
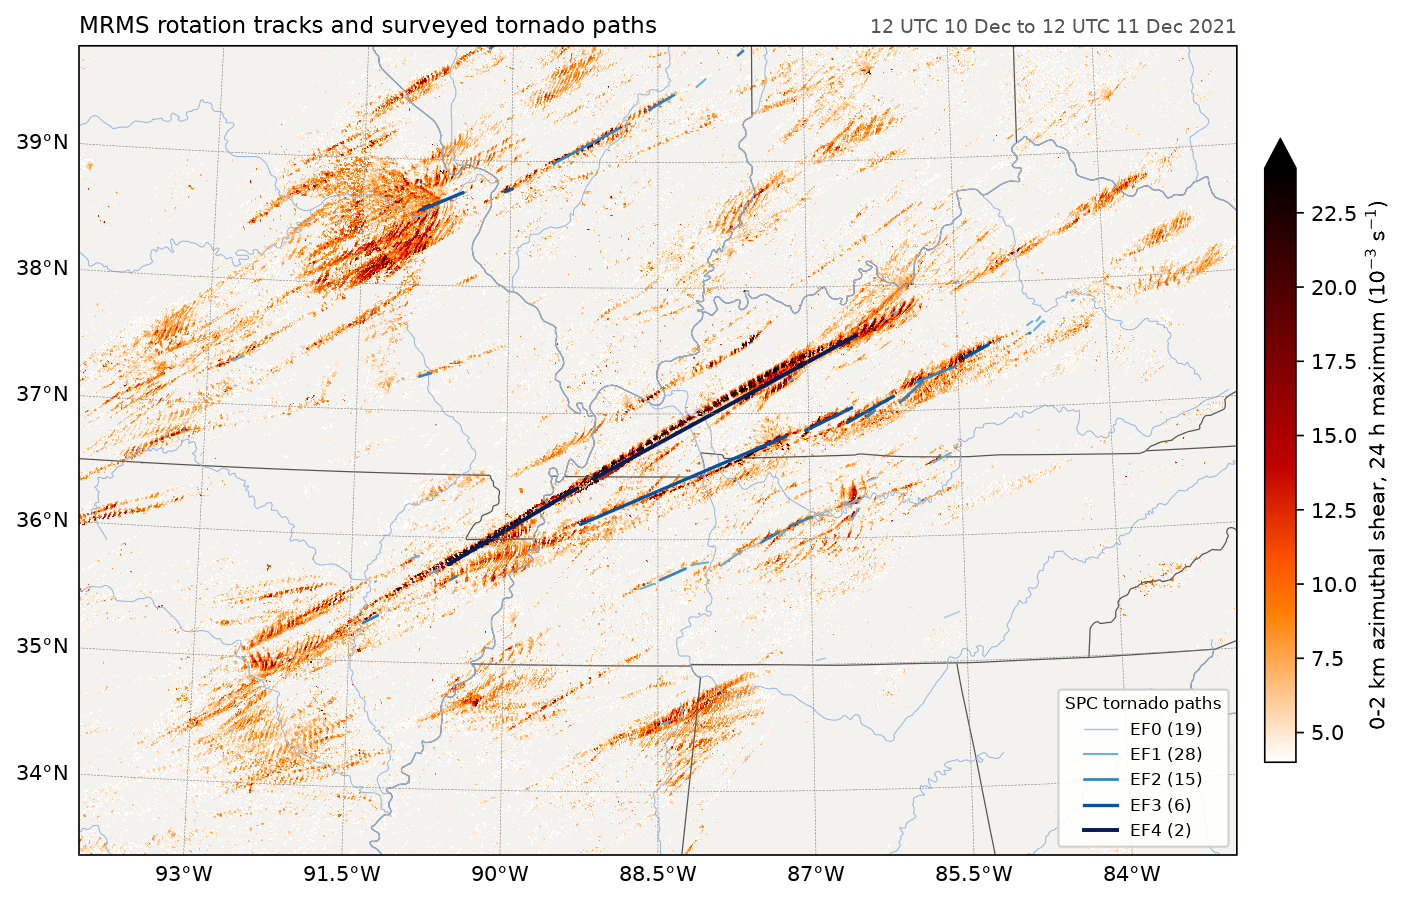
MRMS's 24-hour rotation track, the largest 0-2 km azimuthal shear each point saw between 12 UTC on 10 December and 12 UTC on 11 December 2021, merged from every WSR-88D in range. The blue lines are the 71 tornado paths in the Storm Prediction Center's database for those days, coloured by EF rating. The long swaths of strong shear line up with the surveyed paths, including the 168-mile path from north-west Tennessee across western Kentucky.
Data: MRMS on AWS (noaa-mrms-pds), and SPC's tornado database saved in docs/examples/data/spc_tornadoes_20211210.csv.
docs/examples/tornado_tracks.py
"""Radar-derived rotation against surveyed tornado paths for the outbreak of
10-11 December 2021. The shading is MRMS's 24-hour rotation track: the
largest 0-2 km azimuthal shear each point saw between 12 UTC on the 10th and
12 UTC on the 11th, merged from every WSR-88D in range. The lines are the
71 tornado paths in the Storm Prediction Center's database for those two
days, straight from start to end and coloured by EF rating. The long swaths
of strong shear match the long-track tornadoes, including the 168-mile
(270 km) path from north-west Tennessee across western Kentucky.
"""
import gzip
import os
import urllib.request

import numpy as np

import fastgrib
import fastplot.crs as ccrs
import fastplot.feature as cfeature
import fastplot.pyplot as plt

HERE = os.path.dirname(os.path.abspath(__file__))
MRMS = ('https://noaa-mrms-pds.s3.amazonaws.com/CONUS/RotationTrack1440min_00.50/20211211/'
        'MRMS_RotationTrack1440min_00.50_20211211-120000.grib2.gz')
with urllib.request.urlopen(MRMS) as response:
    grib = fastgrib.open(gzip.decompress(response.read()))

shear = grib.read(0)
lat, lon = grib.latlon()
lat, lon = lat[:, 0], lon[0] - 360
rows, cols = (lat > 33) & (lat < 40.5), (lon > -95) & (lon < -82)
shear = shear[np.ix_(rows, cols)]                              # MRMS stores 10^-3 s^-1
shear = np.where(shear >= 4, shear, np.nan)

paths = np.genfromtxt(os.path.join(HERE, 'data', 'spc_tornadoes_20211210.csv'), delimiter=',',
                      names=True, dtype=None, encoding='utf-8')
ef_colours = {0: '#9ecae1', 1: '#6baed6', 2: '#3182bd', 3: '#08519c', 4: '#081d58'}
data = ccrs.PlateCarree()

fig = plt.figure(figsize=(12, 7.2), dpi=150)
ax = fig.add_subplot(projection=ccrs.LambertConformal(central_longitude=-88.5,
                                                      central_latitude=37))
ax.set_extent([-94, -83, 33.5, 39.8], crs=data)
ax.add_feature(cfeature.LAND, facecolor='#f4f2ee')
mesh = ax.pcolormesh(lon[cols], lat[rows], shear, cmap='gist_heat_r', vmin=4, vmax=24,
                     transform=data)
ax.add_feature(cfeature.STATES, linewidth=0.6, edgecolor='#555555')
ax.add_feature(cfeature.RIVERS, linewidth=0.5)

for ef in range(5):
    sel = paths['mag'] == ef
    for slat, slon, elat, elon in zip(paths['slat'][sel], paths['slon'][sel],
                                      paths['elat'][sel], paths['elon'][sel]):
        if elat == 0:                                            # a single point
            elat, elon = slat, slon
        ax.plot([slon, elon], [slat, elat], color=ef_colours[ef], linewidth=0.7 + 0.3 * ef,
                transform=data)
    ax.plot([], [], color=ef_colours[ef], linewidth=0.7 + 0.3 * ef,
            label='EF%d (%d)' % (ef, sel.sum()))
ax.legend(loc='lower right', fontsize=8, title='SPC tornado paths', title_fontsize=8,
          framealpha=0.9)
grid = ax.gridlines(draw_labels=True, linewidth=0.3, color='#888888', linestyle='--')
grid.top_labels = grid.right_labels = False

fig.colorbar(mesh, ax=ax, shrink=0.75, pad=0.02, extend='max',
             label='0-2 km azimuthal shear, 24 h maximum (10$^{-3}$ s$^{-1}$)')
ax.set_title('MRMS rotation tracks and surveyed tornado paths', loc='left', fontsize=11)
ax.set_title('12 UTC 10 Dec to 12 UTC 11 Dec 2021', loc='right', fontsize=9, color='#555555')

fig.savefig(os.path.join(HERE, '..', 'images', 'tornado_tracks.png'), bbox_inches='tight')