Surface analysis
Sea-level pressure, smoothed a little and labelled every 4 hPa, over 10 m wind speed, with barbs every three degrees. Highs and lows are the extremes of a 41-point window, marked with their central pressure.
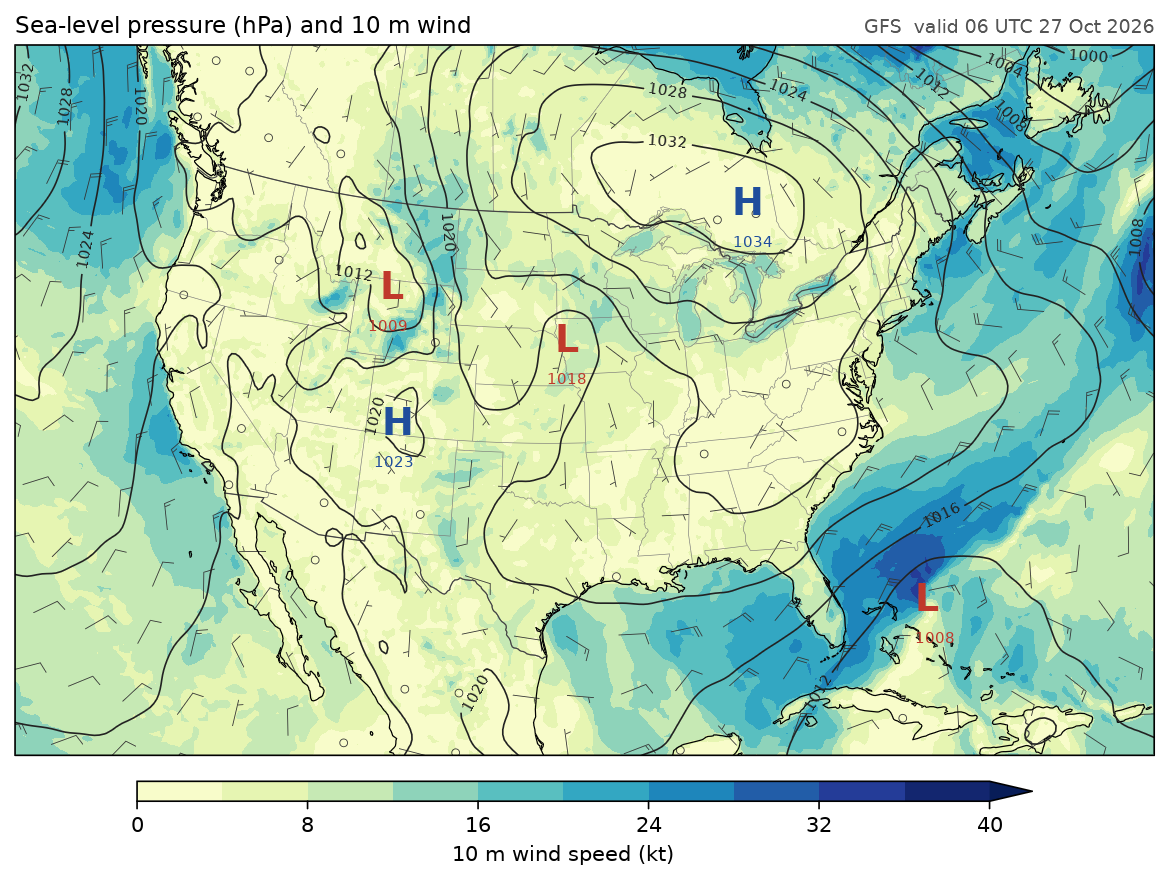
Data: GFS 0.25°, 00 UTC 27 October 2026, six-hour forecast, read with fastgrib from NOAA's archive on AWS. To use a copy you already have, set GFS_FILE to its path.
docs/examples/surface_analysis.py
"""A surface analysis over North America: sea-level pressure and 10 m wind."""
import os

import fastgrib
import numpy as np
from numpy.lib.stride_tricks import sliding_window_view

import fastplot.crs as ccrs
import fastplot.feature as cfeature
import fastplot.pyplot as plt

GFS = 'https://noaa-gfs-bdp-pds.s3.amazonaws.com/gfs.20261027/00/atmos/gfs.t00z.pgrb2.0p25.f006'
grib = fastgrib.open(os.environ.get('GFS_FILE', GFS))


def smooth(z, passes=12):
    """A light 5-point smoother: takes the terrain noise out of sea-level pressure."""
    for _ in range(passes):
        z = z.copy()
        z[1:-1, 1:-1] = 0.5 * z[1:-1, 1:-1] + 0.125 * (z[:-2, 1:-1] + z[2:, 1:-1]
                                                      + z[1:-1, :-2] + z[1:-1, 2:])
    return z


def extremes(z, size=41):
    """Grid points that are the highest (or lowest) within size x size points.
    A square window's maximum is the maximum along rows, then along columns."""
    pad = np.pad(z, size // 2, mode='edge')
    out = []
    for reduce in (np.max, np.min):
        rows = reduce(sliding_window_view(pad, size, axis=1), axis=-1)
        out.append(z == reduce(sliding_window_view(rows, size, axis=0), axis=-1))
    return out


mslp = smooth(grib.read('PRMSL:mean sea level') / 100.0)
u, v = grib.winds(level='10 m above ground')
speed = np.hypot(u, v) * 1.94384                    # knots
lat, lon = grib.latlon()
lat, lon = lat[:, 0], lon[0]
highs, lows = extremes(mslp)

fig = plt.figure(figsize=(11, 7.5), dpi=150)
ax = fig.add_subplot(projection=ccrs.LambertConformal(central_longitude=-97, central_latitude=40))
ax.set_extent([-126, -64, 21, 54], crs=ccrs.PlateCarree())
data = ccrs.PlateCarree()

shaded = ax.contourf(lon, lat, speed, levels=np.arange(0, 41, 4), cmap='YlGnBu',
                     extend='max', transform=data)
isobars = ax.contour(lon, lat, mslp, levels=np.arange(960, 1056, 4), colors='#222222',
                     linewidths=0.8, transform=data)
ax.clabel(isobars, fmt='%d', fontsize=7)

for mask, letter, colour in ((highs, 'H', '#1f4e9c'), (lows, 'L', '#c0392b')):
    for j, i in zip(*np.nonzero(mask)):
        if 20 < lat[j] < 55 and 232 < lon[i] < 298:
            ax.text(lon[i], lat[j], letter, color=colour, fontsize=18, fontweight='bold',
                    ha='center', va='center', transform=data)
            ax.text(lon[i], lat[j] - 1.6, '%.0f' % mslp[j, i], color=colour, fontsize=7,
                    ha='center', va='top', transform=data)

step = 12                                           # one barb every 3 degrees
ax.barbs(lon[::step], lat[::step], u[::step, ::step] * 1.94384, v[::step, ::step] * 1.94384,
         length=5, linewidth=0.4, color='#333333', transform=data)

ax.add_feature(cfeature.STATES, linewidth=0.3, edgecolor='#777777')
ax.add_feature(cfeature.BORDERS, linewidth=0.6, edgecolor='#444444')
ax.coastlines(linewidth=0.6)

cb = fig.colorbar(shaded, ax=ax, orientation='horizontal', shrink=0.7, pad=0.03, aspect=45)
cb.set_label('10 m wind speed (kt)')
ax.set_title('Sea-level pressure (hPa) and 10 m wind', loc='left', fontsize=11)
ax.set_title('GFS  valid 06 UTC 27 Oct 2026', loc='right', fontsize=9, color='#555555')

fig.savefig(os.path.join(os.path.dirname(__file__), '..', 'images', 'surface_analysis.png'),
            bbox_inches='tight')