Warm conveyor belt trajectories
966 air parcels started at 950 hPa over the eastern United States and western Atlantic, carried forward 48 hours by the three-dimensional GFS wind (u, v and omega on 19 levels, every 3 hours, Heun's method in one-hour steps). The 47 that rise more than 600 hPa, the warm conveyor belt criterion of Wernli and Davies (1997), climb from the boundary layer to the jet in about 12 hours and fan out towards Greenland and western Europe.
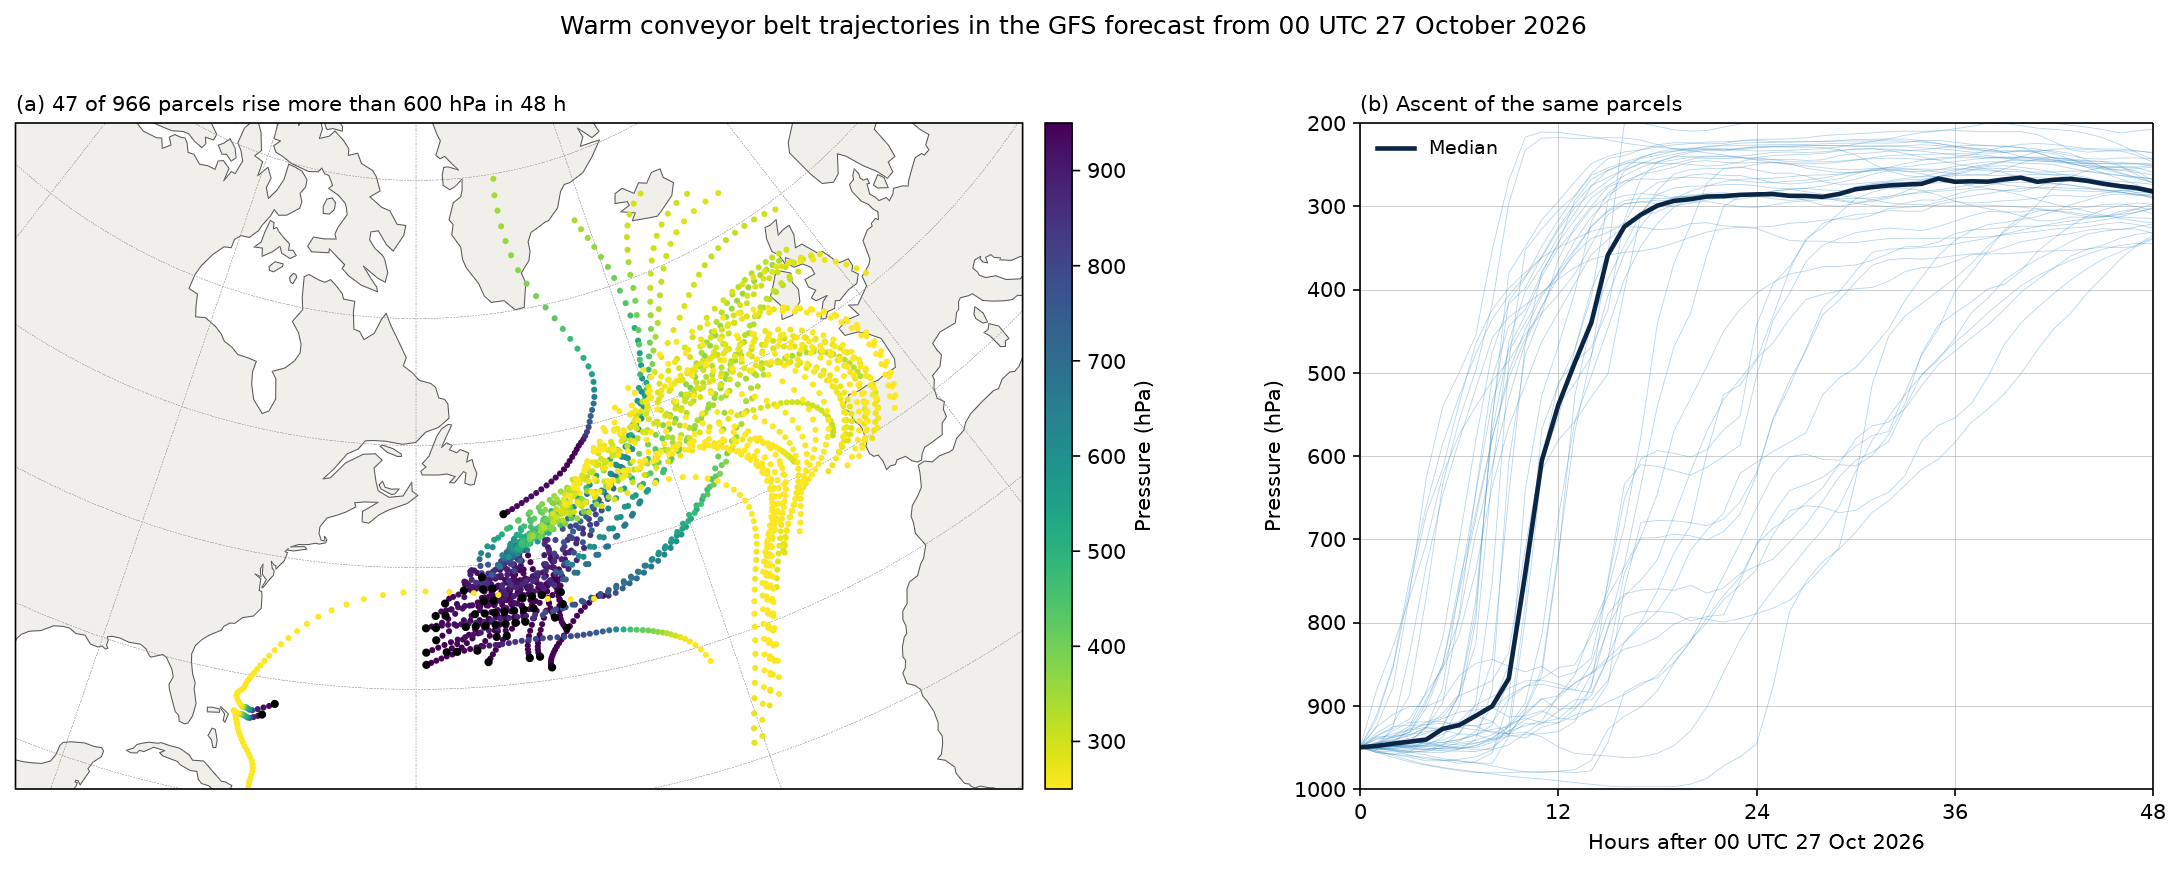
Data: GFS 1° forecasts from 00 UTC 27 October 2026, 17 times from 0 to 48 hours, from NOAA's archive on AWS.
docs/examples/warm_conveyor.py
"""Warm conveyor belts: air parcels traced forward 48 hours through the GFS
forecast from 00 UTC 27 October 2026, and the ones that rise more than
600 hPa in that time, the criterion Wernli and Davies (1997) use to pick
out the warm, moist airstream that ascends ahead of a cold front into the
upper troposphere.

Parcels start every degree at 950 hPa over the eastern United States and
the western Atlantic. Each moves with the GFS wind (u, v and omega, 19
pressure levels from 1000 to 200 hPa, every 3 hours), integrated in one-hour
steps with Heun's method: the wind is interpolated linearly in time,
bilinearly in latitude and longitude, and linearly in log pressure.

(a) The warm conveyor belt trajectories, coloured by pressure, with each
    starting point marked.
(b) Pressure against time for the same parcels, with their median.
"""
import os
from concurrent.futures import ThreadPoolExecutor

import numpy as np

import fastgrib
import fastplot.crs as ccrs
import fastplot.feature as cfeature
import fastplot.pyplot as plt

URL = 'https://noaa-gfs-bdp-pds.s3.amazonaws.com/gfs.20261027/00/atmos/gfs.t00z.pgrb2.1p00.f{:03d}'
HOURS = list(range(0, 49, 3))
LEVELS = [1000, 975, 950, 925, 900, 850, 800, 750, 700, 650, 600, 550, 500, 450, 400, 350,
          300, 250, 200]
R_EARTH = 6.371e6


def winds(hour):
    grib = fastgrib.open(URL.format(hour))
    out = []
    for name in ('UGRD', 'VGRD', 'VVEL'):
        recs = grib.select(name=name, level_kind='isobaricInhPa',
                           level_value=lambda v: v in set(LEVELS))
        out.append(grib.read(sorted(recs, key=lambda r: -r.level_value)))
    return np.array(out, np.float64)                          # (3, level, lat, lon)


with ThreadPoolExecutor(6) as pool:
    wind = np.array(list(pool.map(winds, HOURS)))             # (time, 3, level, lat, lon)
grid_lat = np.arange(-90, 90.5, 1.0)
logp = -np.log(np.array(LEVELS, float))                       # increasing upward


def velocity(hours, lat, lon, p):
    """u, v (m s-1) and omega (Pa s-1) at each parcel, interpolated in time,
    log pressure, latitude and longitude."""
    ft = np.clip(hours / 3.0, 0, len(HOURS) - 1.001)
    t0 = int(ft)
    wt = ft - t0
    fk = np.clip(np.interp(-np.log(p / 100.0), logp, np.arange(len(LEVELS))), 0,
                 len(LEVELS) - 1.001)                      # p in Pa, levels in hPa
    k0 = fk.astype(int)
    wk = fk - k0
    fj = np.clip(lat + 90.0, 0, 179.999)
    j0 = fj.astype(int)
    wj = fj - j0
    fi = lon % 360.0
    i0 = fi.astype(int) % 360
    i1 = (i0 + 1) % 360
    wi = fi - np.floor(fi)
    out = np.zeros((3, lat.size))
    for dt, a in ((0, 1 - wt), (1, wt)):
        for dk, b in ((0, 1 - wk), (1, wk)):
            for dj, c in ((0, 1 - wj), (1, wj)):
                for ii, d in ((i0, 1 - wi), (i1, wi)):
                    out += a * b * c * d * wind[t0 + dt, :, k0 + dk, j0 + dj, ii].T
    return out


slat, slon = np.meshgrid(np.arange(25.0, 46.0, 1.0), np.arange(-90.0, -44.0, 1.0),
                         indexing='ij')
lat, lon = slat.ravel().copy(), slon.ravel().copy()
p = np.full(lat.size, 95000.0)
path = [(lat.copy(), lon.copy(), p.copy())]
dt = 3600.0


def move(lat, lon, p, uvw, dt):
    u, v, w = uvw
    return (lat + np.degrees(v * dt / R_EARTH),
            lon + np.degrees(u * dt / (R_EARTH * np.cos(np.radians(lat)))),
            np.clip(p + w * dt, 20000.0, 100000.0))


for step in range(48):
    hours = float(step)
    k1 = velocity(hours, lat, lon, p)
    lat1, lon1, p1 = move(lat, lon, p, k1, dt)
    k2 = velocity(hours + 1, lat1, lon1, p1)
    lat, lon, p = move(lat, lon, p, 0.5 * (k1 + k2), dt)
    path.append((lat.copy(), lon.copy(), p.copy()))

plat, plon, pres = (np.array([s[k] for s in path]) for k in range(3))   # (time, parcel)
pres /= 100.0
ascent = pres[0] - pres.min(axis=0)
wcb = ascent >= 600
hours = np.arange(len(path))

W, H = 15.0, 6.0                                             # inches
bottom, height = 0.12, 0.74                                  # both panels the same height
fig = plt.figure(figsize=(W, H), dpi=150)
data = ccrs.PlateCarree()
proj = ccrs.LambertConformal(central_longitude=-60, central_latitude=45)
ax = fig.add_axes((0.03, bottom, 0.5, height), projection=proj)
ax.set_extent([-95, -5, 22, 68], crs=data)
x0, x1, y0, y1 = ax.get_extent()
map_width = height * H * (x1 - x0) / (y1 - y0) / W          # the map's own shape
ax.set_position((0.03, bottom, map_width, height))
ax.add_feature(cfeature.LAND, facecolor='#f1efe9')
ax.coastlines(linewidth=0.5, color='#555555')
order = np.argsort(-pres[:, wcb].ravel())
points = ax.scatter(plon[:, wcb].ravel()[order], plat[:, wcb].ravel()[order], s=2,
                    c=pres[:, wcb].ravel()[order], cmap='viridis_r', vmin=250, vmax=950,
                    transform=data, zorder=3)
ax.scatter(plon[0, wcb], plat[0, wcb], s=6, color='black', transform=data, zorder=4)
ax.gridlines(linewidth=0.25, color='#888888', linestyle='--')
cax = fig.add_axes((0.03 + map_width + 0.01, bottom, 0.012, height))
fig.colorbar(points, cax=cax, label='Pressure (hPa)')
ax.set_title('(a) %d of %d parcels rise more than 600 hPa in 48 h' % (wcb.sum(), wcb.size),
             loc='left', fontsize=10)

ax2 = fig.add_axes((0.03 + map_width + 0.15, bottom, 0.95 - map_width - 0.15, height))
for k in np.nonzero(wcb)[0]:
    ax2.plot(hours, pres[:, k], color='#2e86c1', linewidth=0.4, alpha=0.35)
ax2.plot(hours, np.median(pres[:, wcb], axis=1), color='#0b2545', linewidth=2.2,
         label='Median')
ax2.set_ylim(1000, 200)
ax2.set_xlim(0, 48)
ax2.set_xticks(range(0, 49, 12))
ax2.set_xlabel('Hours after 00 UTC 27 Oct 2026')
ax2.set_ylabel('Pressure (hPa)')
ax2.grid(True, linewidth=0.3)
ax2.legend(loc='upper left', frameon=False, fontsize=9)
ax2.set_title('(b) Ascent of the same parcels', loc='left', fontsize=10)

fig.suptitle('Warm conveyor belt trajectories in the GFS forecast from 00 UTC 27 October 2026',
             fontsize=12)
fig.savefig(os.path.join(os.path.dirname(os.path.abspath(__file__)), '..', 'images',
                         'warm_conveyor.png'), bbox_inches='tight')