Blizzard meteogram
Every routine and special observation at Buffalo Niagara airport through the December 2022 blizzard. An arctic front arrives on the morning of the 23rd: the temperature falls from 38 °F to 6 °F in twelve hours, gusts reach 60 kt off Lake Erie, and visibility stays near zero for most of two days. The wind chill is computed with the NWS formula.
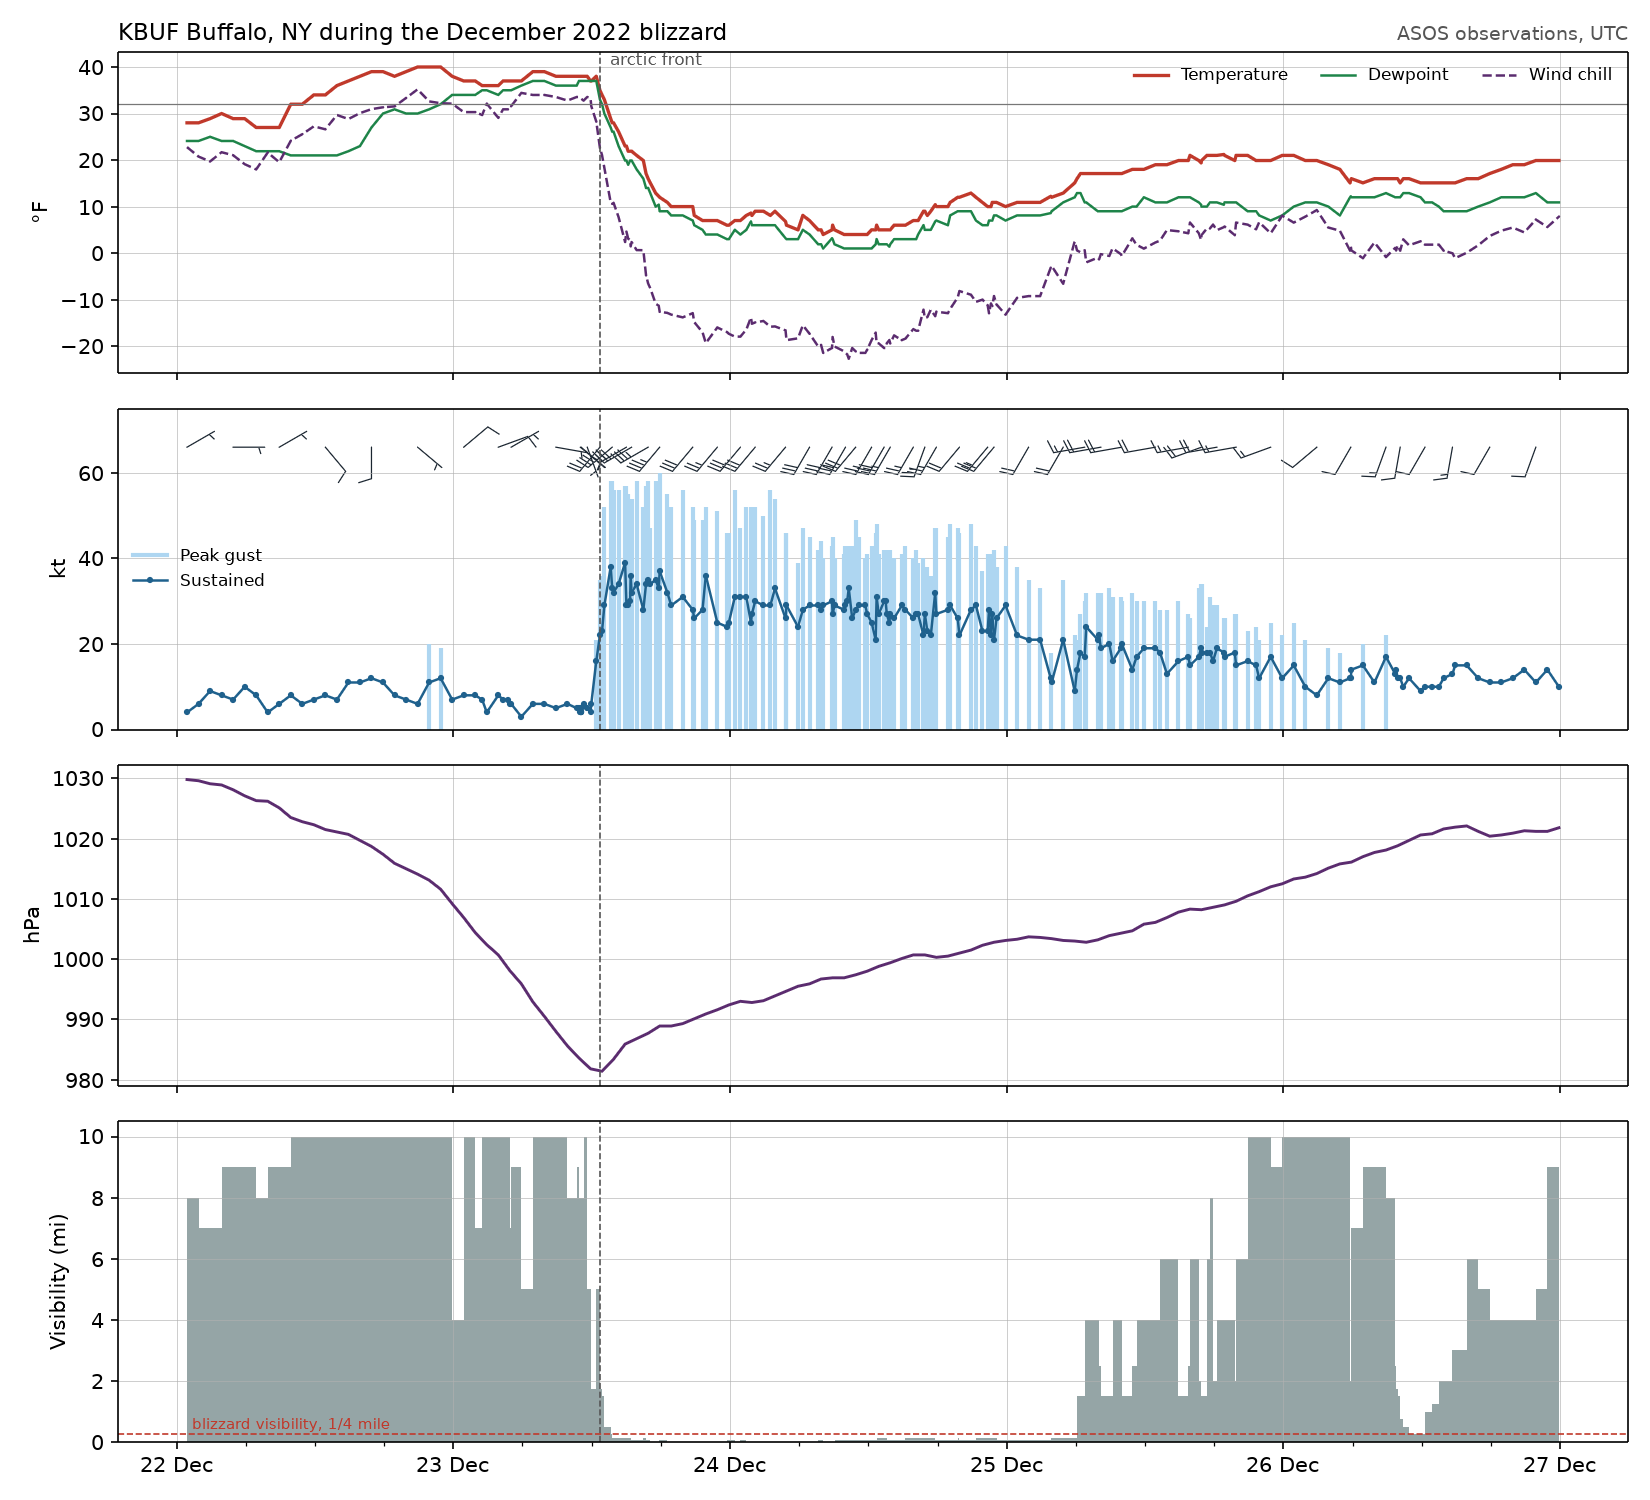
Data: Iowa Environmental Mesonet ASOS archive, saved in docs/examples/data/asos_BUF_blizzard.csv.
docs/examples/meteogram.py
"""The Buffalo blizzard of December 2022 at Buffalo Niagara airport (KBUF):
every routine and special observation from 22 to 27 December. An arctic
front arrives on the morning of the 23rd: the temperature falls from 38 °F
to 6 °F in twelve hours, gusts reach 60 kt from the south-west off Lake
Erie, and visibility stays near zero for most of two days. The wind chill is
computed from temperature and wind speed with the NWS formula (2001), which
applies below 50 °F with wind above 3 mph. Data from the Iowa Environmental
Mesonet's ASOS archive.
"""
import os
from datetime import datetime

import numpy as np

import fastplot.dates as mdates
import fastplot.pyplot as plt

HERE = os.path.dirname(os.path.abspath(__file__))
obs = np.genfromtxt(os.path.join(HERE, 'data', 'asos_BUF_blizzard.csv'), delimiter=',', names=True,
                    dtype=None, encoding='utf-8', missing_values='', filling_values=np.nan)
time = np.array([datetime.strptime(t, '%Y-%m-%d %H:%M') for t in obs['valid']])

temp = obs['tmpf']
speed, gust, direction = obs['sknt'], obs['gust'], obs['drct']
mph = speed * 1.15078
wind_chill = np.where((temp <= 50) & (mph > 3),
                      35.74 + 0.6215 * temp - 35.75 * mph ** 0.16 + 0.4275 * temp * mph ** 0.16,
                      np.nan)
front = datetime(2022, 12, 23, 12, 43)

fig, axes = plt.subplots(4, 1, figsize=(11, 10), dpi=150, sharex=True)
ax1, ax2, ax3, ax4 = axes

ok = np.isfinite(temp)
ax1.plot(time[ok], temp[ok], color='#c0392b', linewidth=1.6, label='Temperature')
ax1.plot(time[ok], obs['dwpf'][ok], color='#1e8449', linewidth=1.2, label='Dewpoint')
cold = np.isfinite(wind_chill)
ax1.plot(time[cold], wind_chill[cold], color='#5b2c6f', linewidth=1.2, linestyle='--',
         label='Wind chill')
ax1.axhline(32, color='#777777', linewidth=0.6)
ax1.set_ylabel('°F')
ax1.legend(loc='upper right', fontsize=8, frameon=False, ncol=3)

ax2.vlines(time, 0, gust, color='#aed6f1', linewidth=2.0, label='Peak gust')
ax2.plot(time, speed, 'o-', color='#1f618d', markersize=2, linewidth=1.2, label='Sustained')
hourly = np.isfinite(direction) & np.isfinite(speed) & (np.arange(time.size) % 4 == 0)
u = -speed * np.sin(np.radians(direction))
v = -speed * np.cos(np.radians(direction))
ax2.barbs(mdates.date2num(time[hourly]), np.full(hourly.sum(), 66.0), u[hourly], v[hourly],
          length=5.5, linewidth=0.6, color='#1b2631')
ax2.set_ylim(0, 75)
ax2.set_ylabel('kt')
ax2.legend(loc='center left', fontsize=8, frameon=False)

ok = np.isfinite(obs['mslp'])
ax3.plot(time[ok], obs['mslp'][ok], color='#5b2c6f', linewidth=1.4)
ax3.set_ylabel('hPa')

ok = np.isfinite(obs['vsby'])
ax4.fill_between(time[ok], 0, obs['vsby'][ok], step='post', color='#95a5a6')
ax4.axhline(0.25, color='#c0392b', linewidth=0.8, linestyle='--')
ax4.text(time[0], 0.3, ' blizzard visibility, 1/4 mile', fontsize=7, color='#c0392b',
         va='bottom')
ax4.set_ylim(0, 10.5)
ax4.set_ylabel('Visibility (mi)')

for ax in axes:
    ax.axvline(front, color='#555555', linestyle='--', linewidth=0.8)
    ax.grid(True, linewidth=0.3)
ax1.text(front, ax1.get_ylim()[1], '  arctic front', color='#555555', fontsize=8, va='top')
ax4.xaxis.set_major_locator(mdates.DayLocator())
ax4.xaxis.set_major_formatter(mdates.DateFormatter('%d %b'))
ax4.xaxis.set_minor_locator(mdates.HourLocator(byhour=[6, 12, 18]))
ax1.set_title('KBUF Buffalo, NY during the December 2022 blizzard', loc='left', fontsize=11)
ax1.set_title('ASOS observations, UTC', loc='right', fontsize=9, color='#555555')
fig.tight_layout()

fig.savefig(os.path.join(HERE, '..', 'images', 'meteogram.png'))