Speed
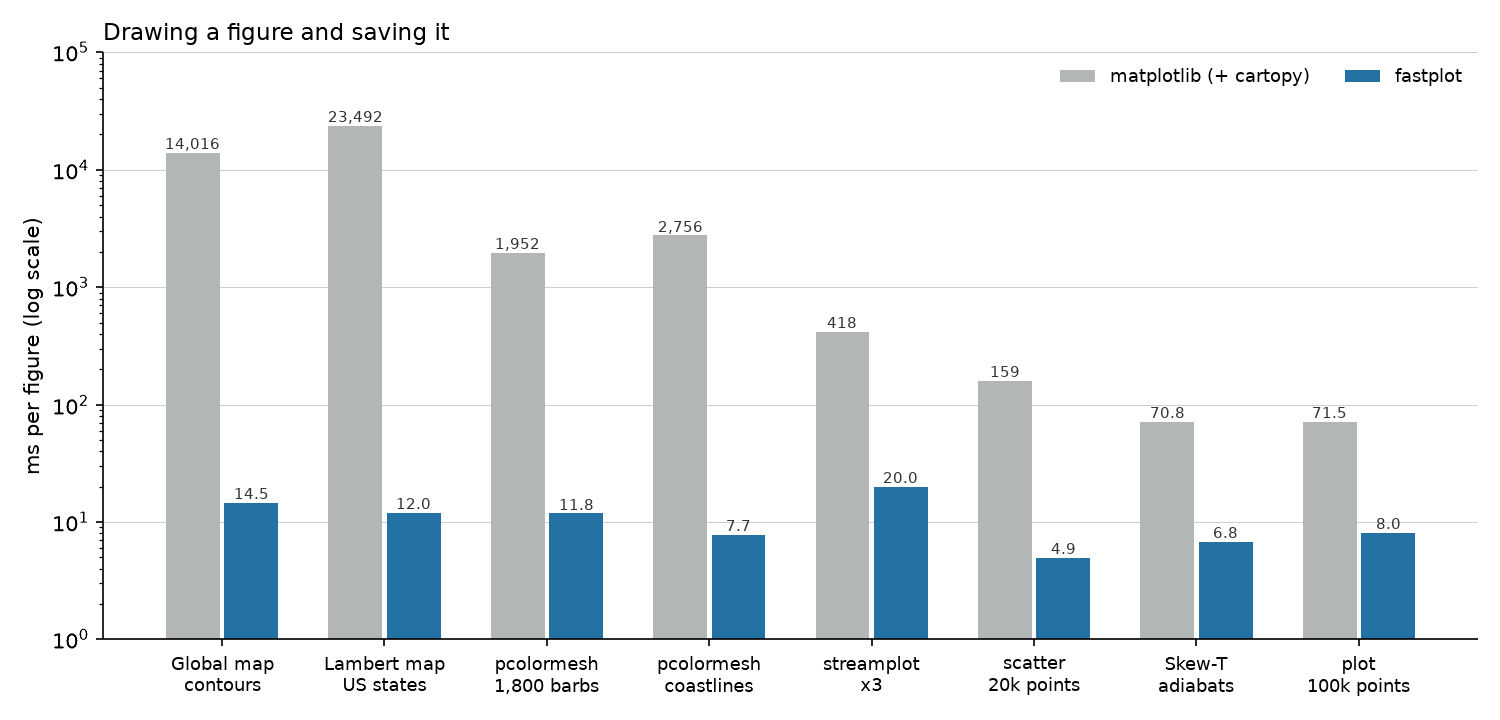
All times are for warm frames (each a new figure, PNG written), measured on
Windows 11 with an Intel i7-13700K (8 performance and 8 efficiency cores)
and an RTX 5070 Ti. fastplot's numbers are the median of 9 runs and
matplotlib's the median of 5, since its times vary by about 30% between
runs. The scripts are in tools/, so you can measure your own machine.
Maps
One GFS 0.25° field (1440 x 721) at 1800 x 975 pixels, tools/bench.py:
| Figure | matplotlib + cartopy | fastplot CPU | fastplot GPU | Speed-up |
|---|---|---|---|---|
pcolormesh |
2,177 ms | 6.1 ms | 6.7 ms | 360x |
contourf, 43 levels |
18,831 ms | 5.1 ms | 5.3 ms | 3,700x |
contour + clabel |
2,205 ms | 14.9 ms | 14.0 ms | 150x |
| pcolormesh, coastlines, borders, gridline labels, colorbar | 2,756 ms | 7.7 ms | 7.6 ms | 360x |
| contourf and the same | 19,495 ms | 7.0 ms | 6.5 ms | 2,800x |
| contourf, contour and the same | 14,016 ms | 14.5 ms | 14.5 ms | 970x |
| Lambert CONUS: contourf, contour, states | 23,492 ms | 12.0 ms | 11.3 ms | 1,950x |
| pcolormesh and 1,800 wind barbs | 1,952 ms | 11.8 ms | 11.5 ms | 165x |
Most of cartopy's time goes into reprojecting polygons one by one, which
fastplot never does. Plain matplotlib without cartopy is quicker, at about
185 ms for imshow, 370 ms for pcolormesh and 650 ms for contourf of the
same field, so on non-map figures the gain is more like 10 to 30 times.
Plots
800 x 500 pixels, tools/bench_plain.py, CPU:
| Figure | matplotlib | fastplot | Speed-up |
|---|---|---|---|
plot, 100k points |
71.5 ms | 8.0 ms | 9x |
scatter, 20k points coloured by value |
158.8 ms | 4.9 ms | 32x |
hist, 1M values, 100 bins |
63.6 ms | 3.3 ms | 19x |
bar (50) with error bars |
78.2 ms | 3.1 ms | 25x |
pcolormesh 500 x 500 |
163.6 ms | 4.5 ms | 36x |
contourf + contour 300 x 200 |
83.3 ms | 4.3 ms | 19x |
imshow RGB 600 x 400 |
106.1 ms | 3.9 ms | 27x |
Log-pressure fill_betweenx |
68.5 ms | 2.7 ms | 25x |
| Skew-T with barbs, CAPE/CIN, adiabats and mixing lines, 700 x 700 | 70.8 ms | 6.8 ms | 10x |
streamplot x3, including integration |
418 ms | 20 ms | 21x |
| Two hodographs with rings, coloured lines and vectors | 52.3 ms | 5.8 ms | 9x |
tricontourf, tricontour + clabel, tripcolor x2, triplot (400 points) |
109.3 ms | 8.5 ms | 13x |
How it works
matplotlib builds a tree of Python artist objects and Agg paints their paths
one at a time. cartopy first reprojects every polygon through shapely; a
global contourf is around 21,000 rings, each a separate Python call.
fastplot does not build polygons for fields at all. For every pixel of the map it takes the pixel's projected position, converts it back to longitude and latitude, and looks up the value in the data grid, so the cost depends on the size of the image rather than on the shape of the contours. Colours come from a lookup table with matplotlib's band edges.
Lines (contours, which are the same lines contourpy finds, coastlines, borders, barbs and gridlines) are cut into segments and sorted into 32 x 32 pixel tiles, and each tile is drawn with anti-aliasing on its own core. Text is cached as glyph masks rendered with FreeType through Pillow, with kerning and matplotlib's mathtext layout. Layout is computed once from text sizes using matplotlib's rules for subplot parameters, gridspecs, aspect ratios and colorbars. Finally the PNG encoder filters and compresses the image on every core.
Start-up
A fresh process that imports fastplot, draws one full map and saves it takes
about a second, most of it numba loading its compiled kernels. matplotlib
and cartopy take over ten seconds for the same script. In a long-running
process, or with frames, only the first figure pays
that.