GFS 2 m temperature on six projections
The same 2 m temperature field on six of the projections fastplot supports. Every panel has the same height, with its width set by the shape of the map, which each axes reports through get_extent().
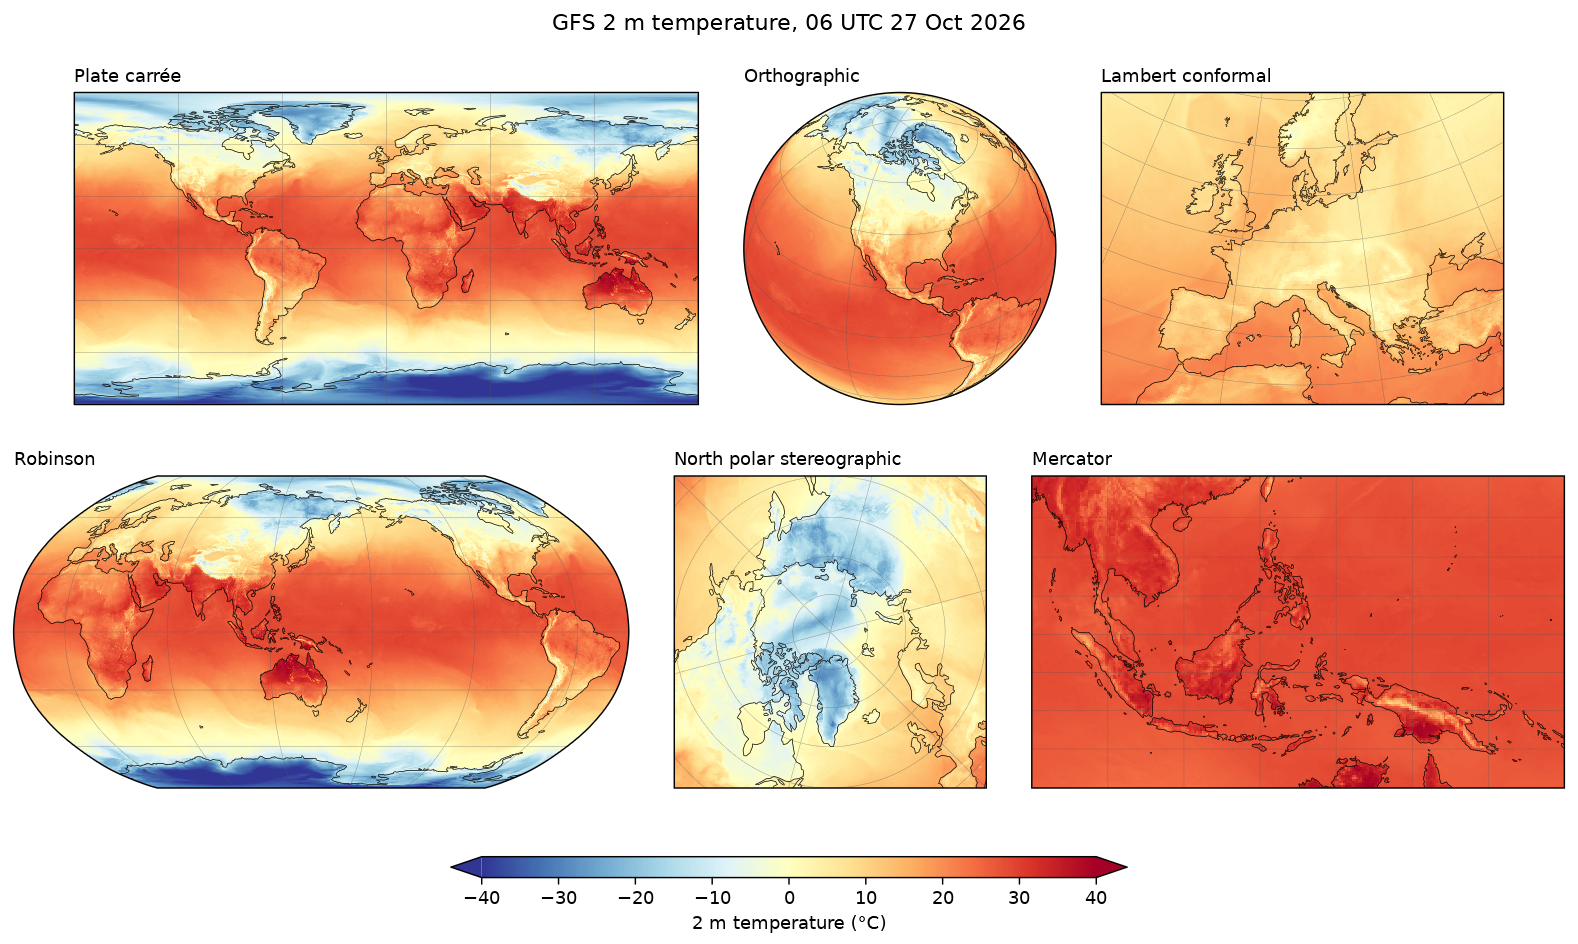
Data: GFS 0.25°, 00 UTC 27 October 2026, six-hour forecast, read with fastgrib from NOAA's archive on AWS. To use a copy you already have, set GFS_FILE to its path.
docs/examples/projections.py
"""GFS 2 m temperature on six of the map projections fastplot supports. Every
panel has the same height; its width follows the shape of the map, which
each axes reports through get_extent() once its extent is set."""
import os

import fastgrib

import fastplot.crs as ccrs
import fastplot.pyplot as plt

GFS = 'https://noaa-gfs-bdp-pds.s3.amazonaws.com/gfs.20261027/00/atmos/gfs.t00z.pgrb2.0p25.f006'
grib = fastgrib.open(os.environ.get('GFS_FILE', GFS))

t2m = grib.read('TMP:2 m above ground') - 273.15
lat, lon = grib.latlon()
lat, lon = lat[:, 0], lon[0]
data = ccrs.PlateCarree()

rows = [
    [('Plate carrée', ccrs.PlateCarree(), None),
     ('Orthographic', ccrs.Orthographic(central_longitude=-100, central_latitude=35), None),
     ('Lambert conformal', ccrs.LambertConformal(central_longitude=10, central_latitude=50,
                                                 standard_parallels=(40, 60)),
      [-15, 35, 33, 64])],
    [('Robinson', ccrs.Robinson(central_longitude=150), None),
     ('North polar stereographic', ccrs.NorthPolarStereo(central_longitude=-45),
      [-180, 180, 50, 90]),
     ('Mercator', ccrs.Mercator(), [90, 160, -15, 25])],
]

W, H = 13.0, 7.3                                       # inches
gap, panel_h = 0.35, 2.4                               # inches between panels, and their height
fig = plt.figure(figsize=(W, H), dpi=130)
for r, row in enumerate(rows):
    made = []
    for name, proj, extent in row:
        ax = fig.add_axes((0, 0, 0.1, 0.1), projection=proj)
        ax.set_global() if extent is None else ax.set_extent(extent, crs=data)
        x0, x1, y0, y1 = ax.get_extent()
        made.append((ax, name, panel_h * (x1 - x0) / (y1 - y0)))
    left = (W - sum(w for _, _, w in made) - gap * (len(made) - 1)) / 2
    bottom = H - 0.75 - (r + 1) * panel_h - r * 0.55
    for ax, name, width in made:
        ax.set_position((left / W, bottom / H, width / W, panel_h / H))
        left += width + gap
        mesh = ax.pcolormesh(lon, lat, t2m, cmap='RdYlBu_r', vmin=-40, vmax=40, transform=data)
        ax.coastlines(linewidth=0.4)
        ax.gridlines(linewidth=0.25, color='#555555', alpha=0.6)
        ax.set_title(name, fontsize=10, loc='left')

cax = fig.add_axes((0.3, 0.07, 0.4, 0.022))
fig.colorbar(mesh, cax=cax, orientation='horizontal', label='2 m temperature (°C)',
             extend='both')
fig.suptitle('GFS 2 m temperature, 06 UTC 27 Oct 2026', fontsize=12)

fig.savefig(os.path.join(os.path.dirname(__file__), '..', 'images', 'projections.png'),
            bbox_inches='tight')