Gallery
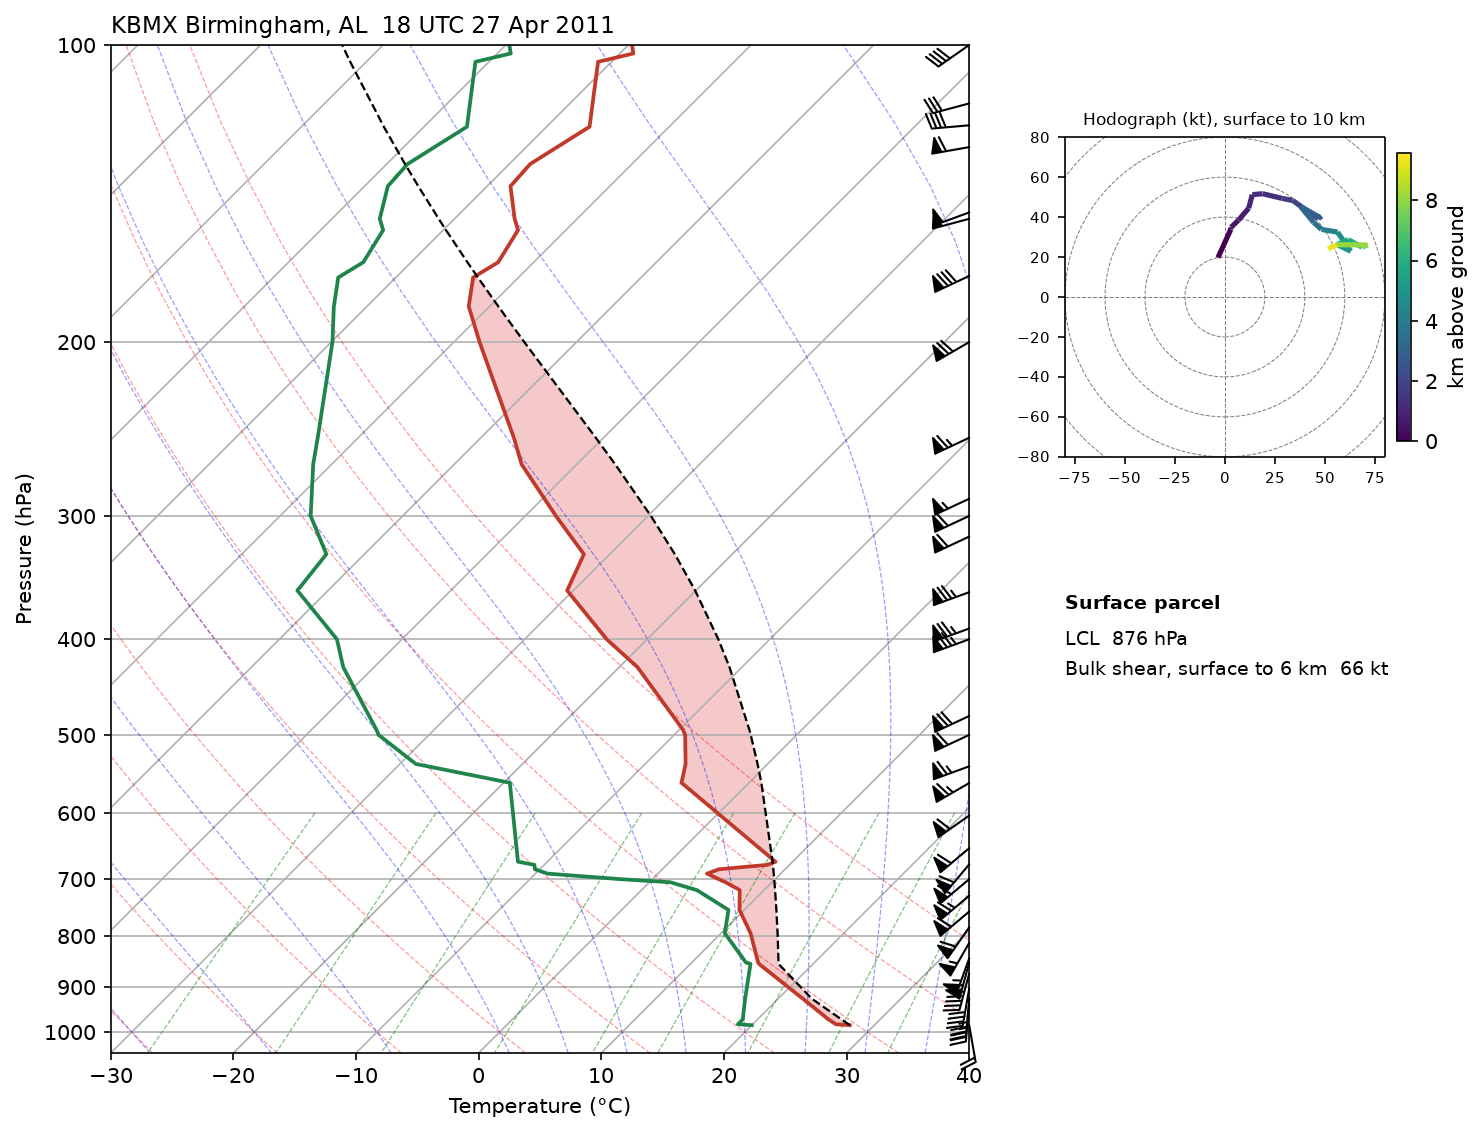
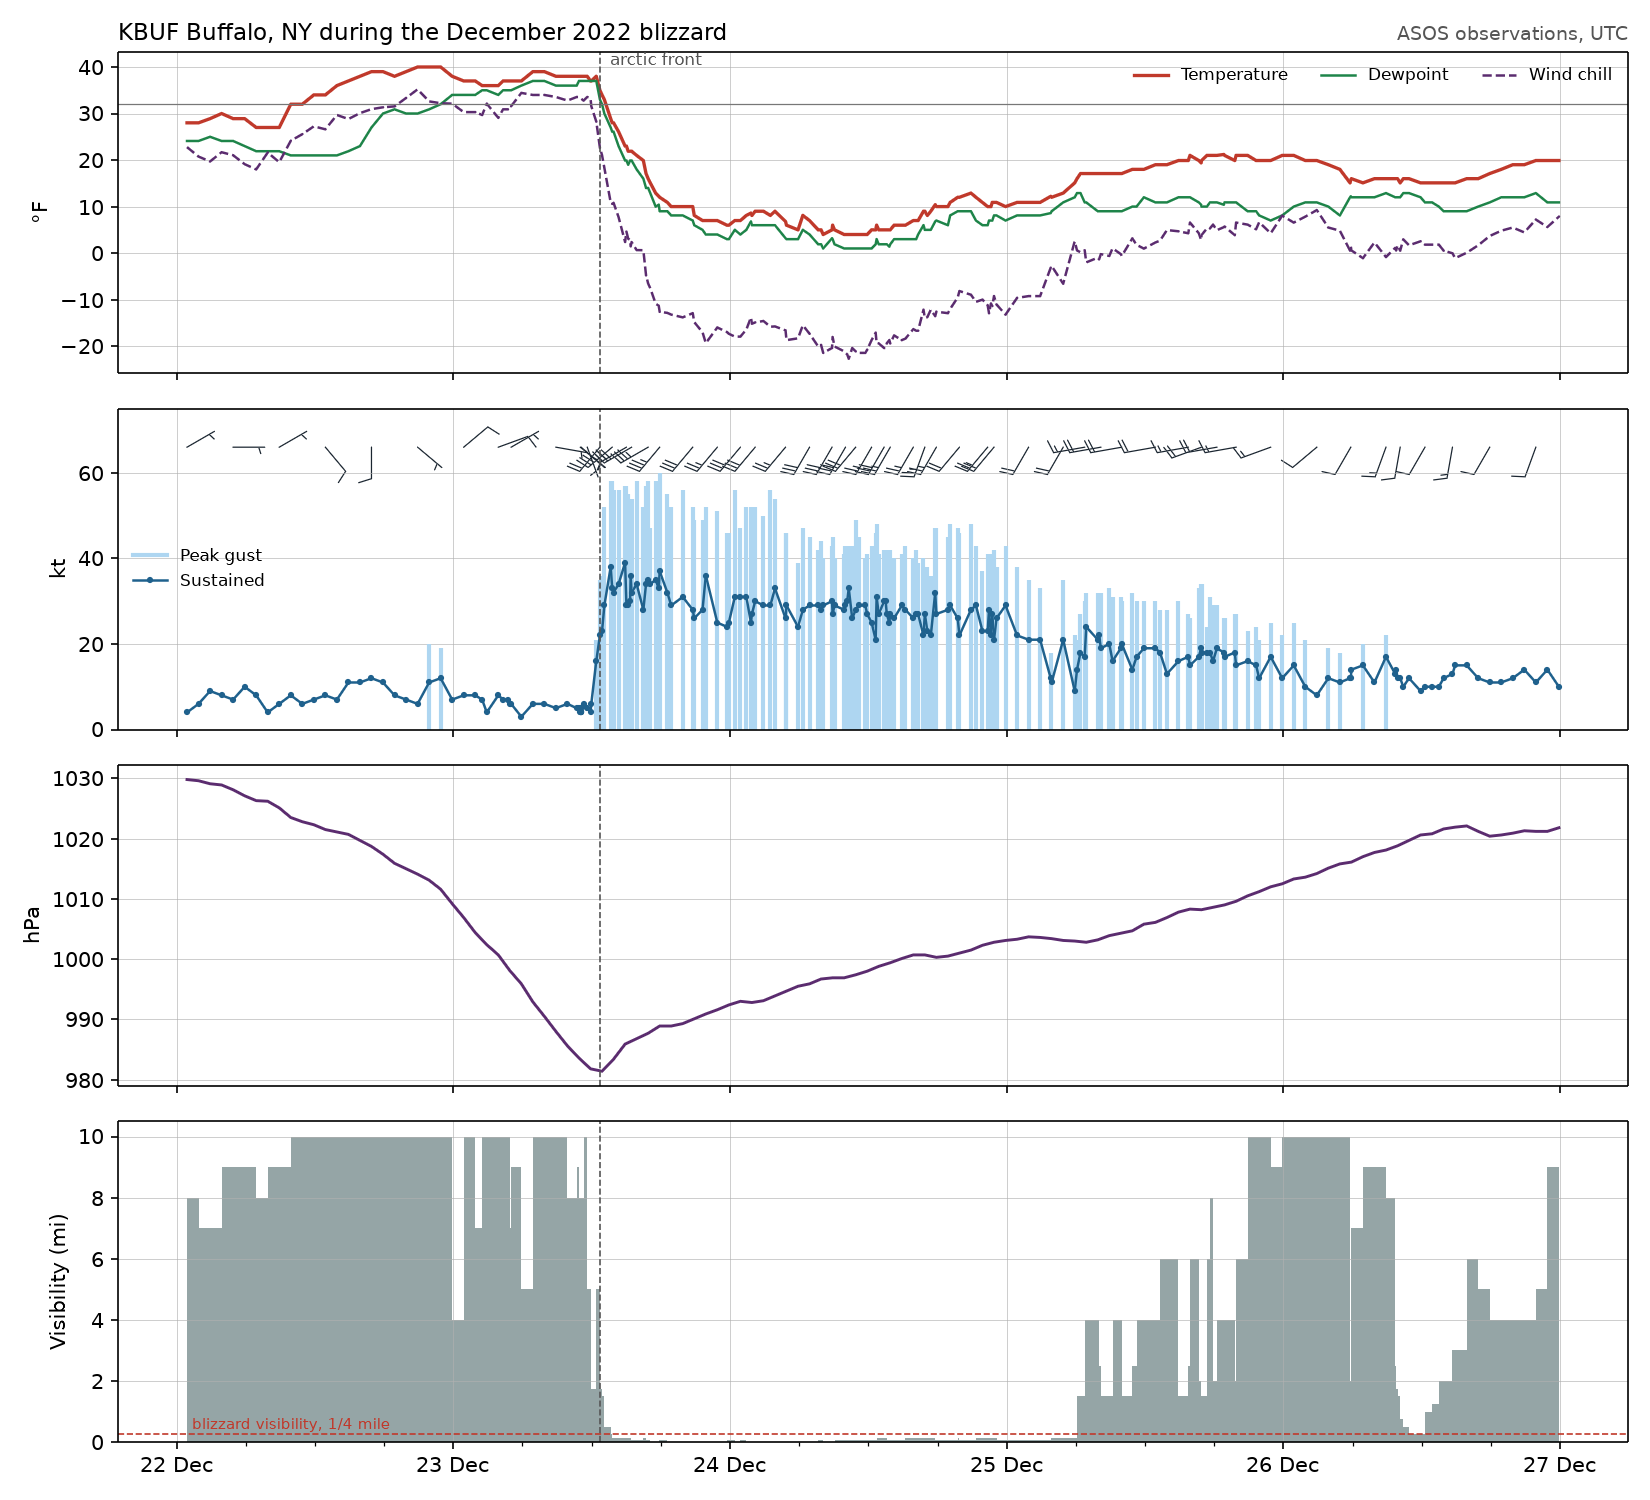
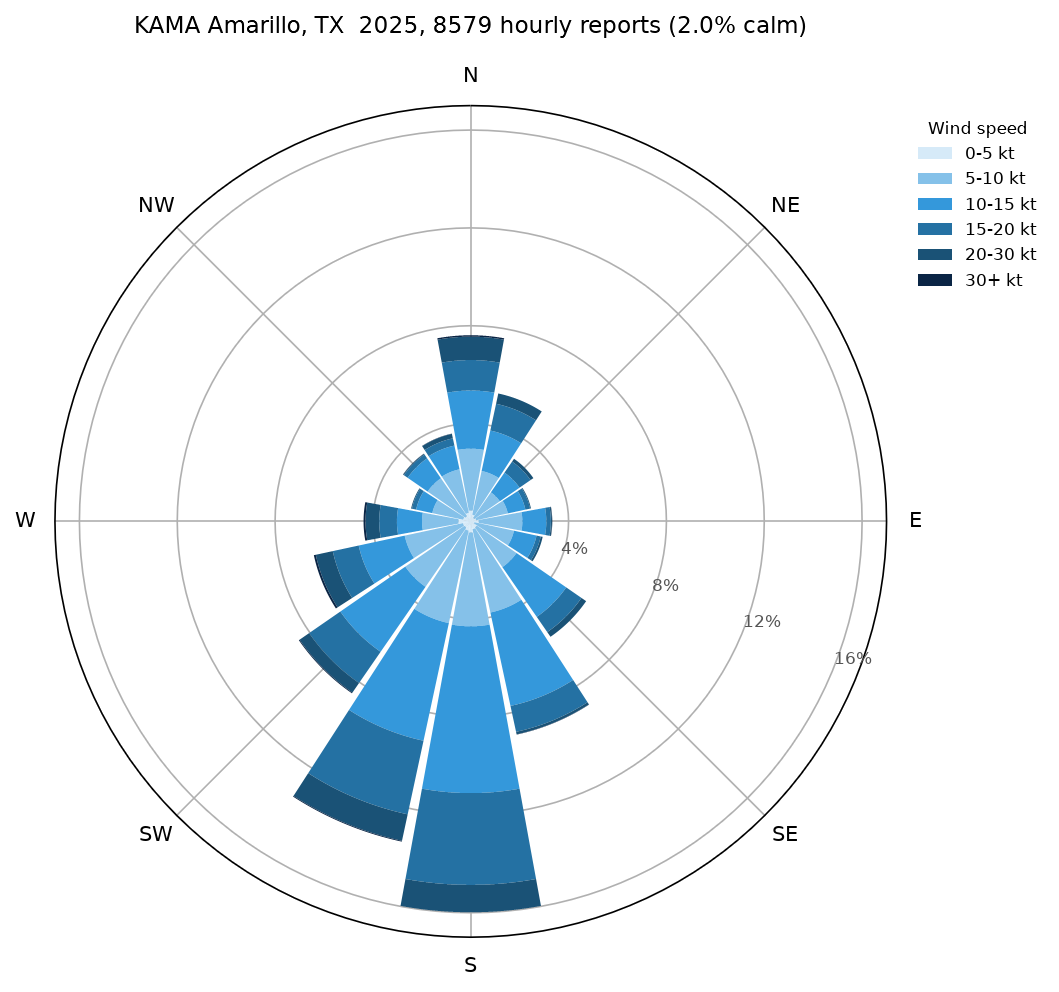
Each example is a complete script with the figure it produces, and all of them use real data: model output from GFS, HAFS and MRMS, and METAR, radiosonde, ASOS and Storm Prediction Center records. The scripts are in docs/examples/.
Atmospheric dynamics
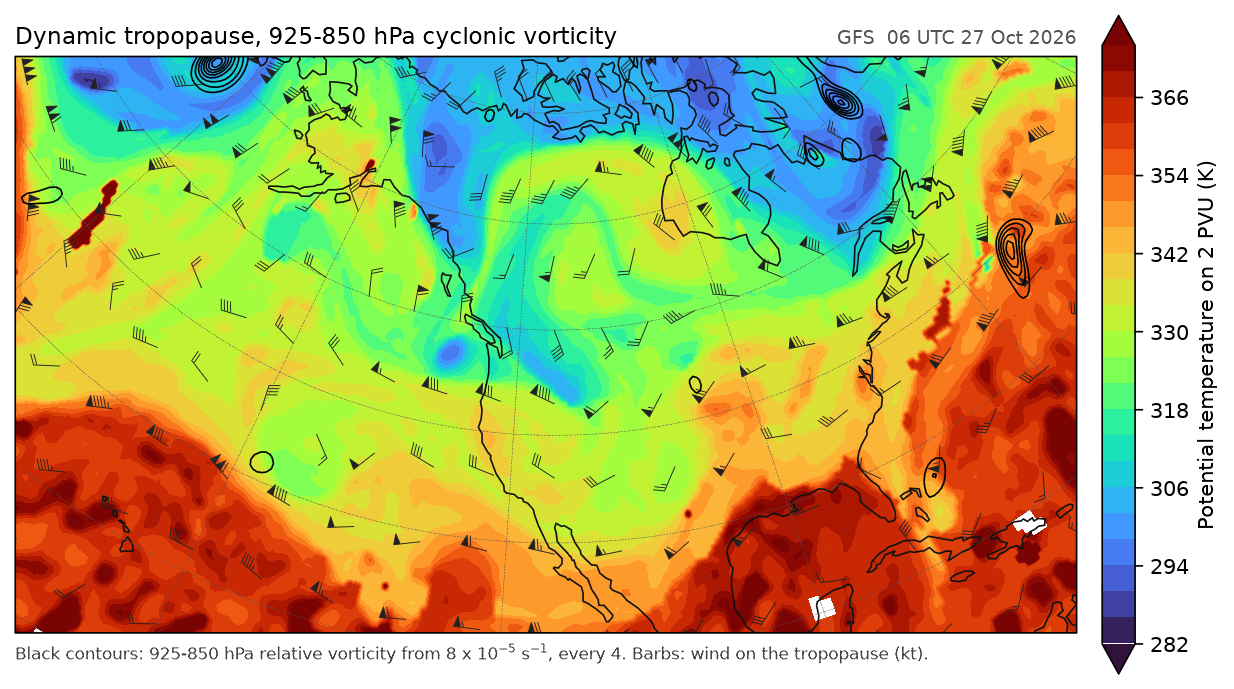
Dynamic tropopause mapPotential temperature and wind on the 2 PVU surface
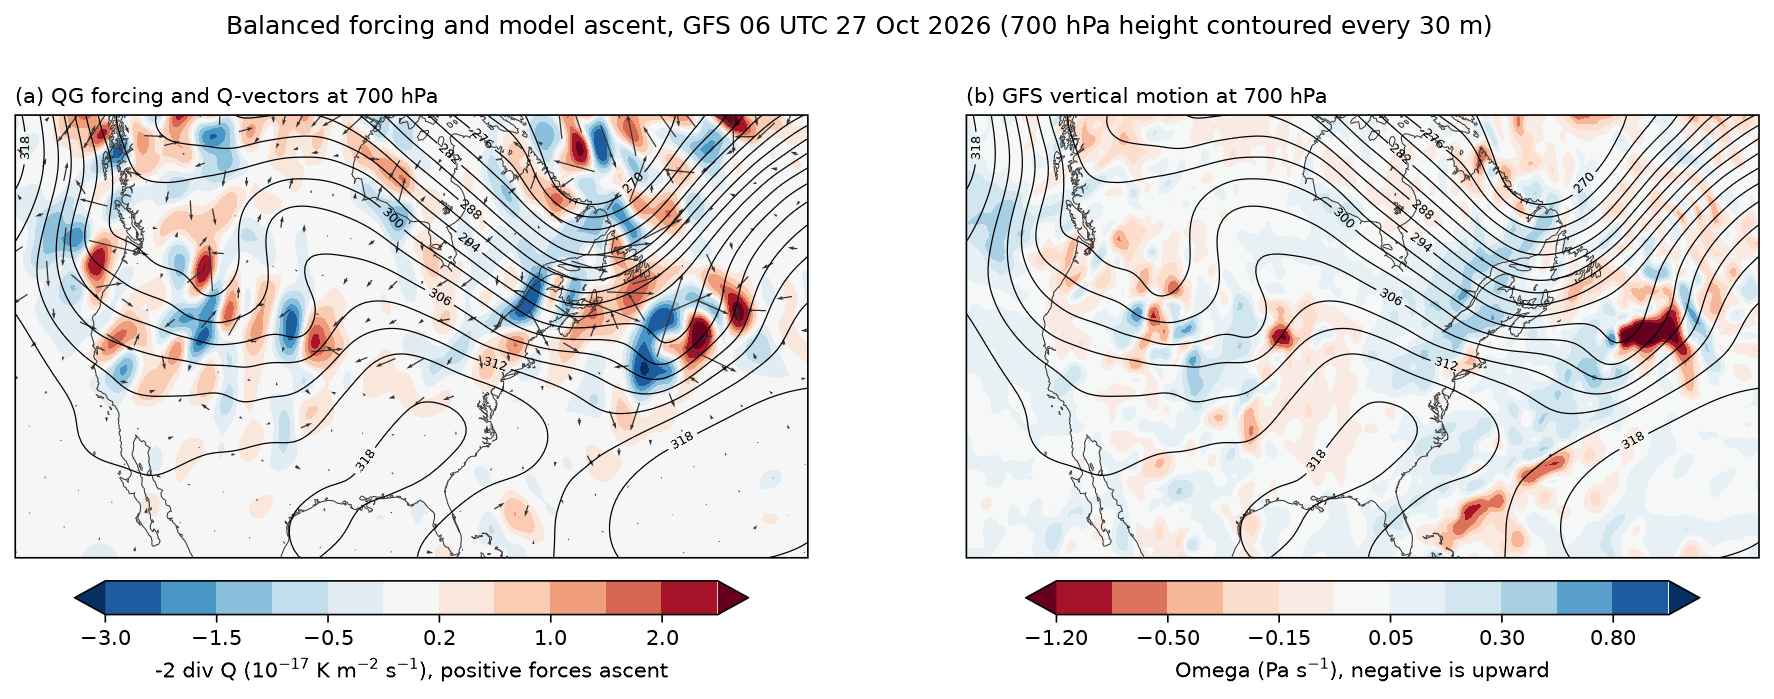
Quasi-geostrophic forcing and model ascentQ-vector forcing against the GFS vertical motion at 700 hPa
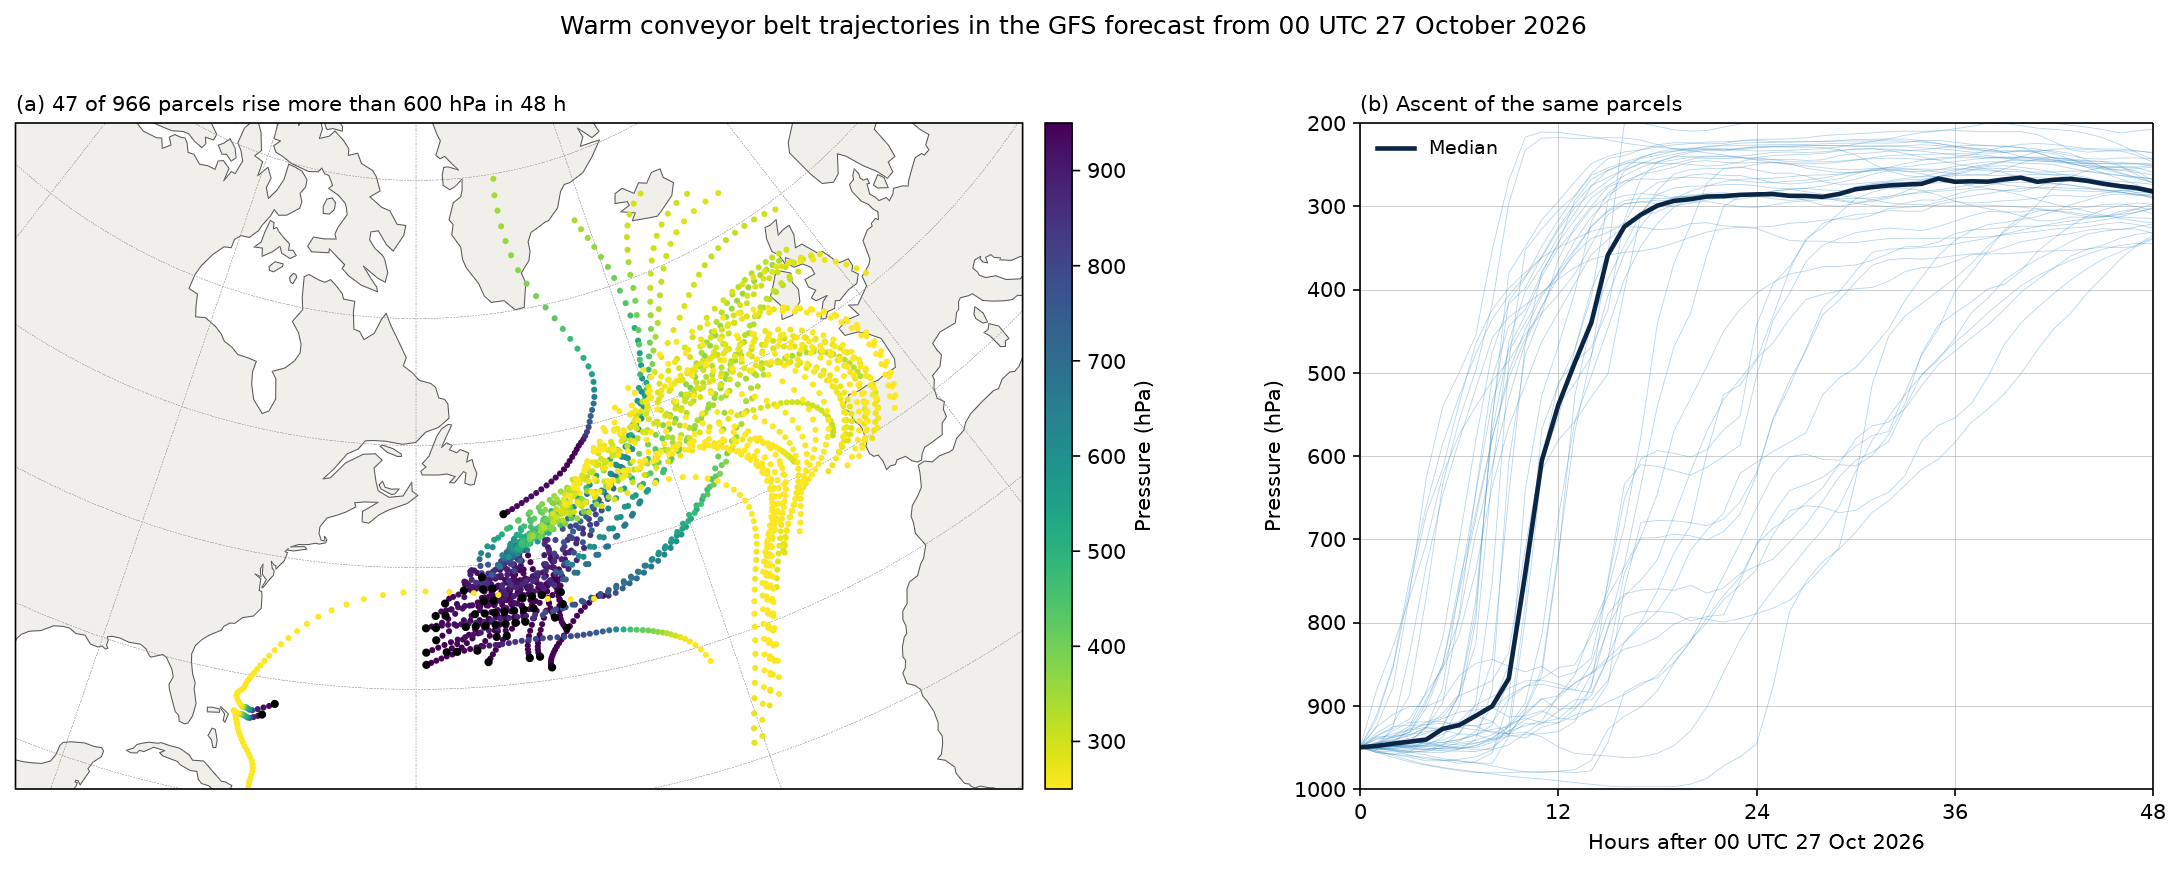
Warm conveyor belt trajectoriesAir parcels rising 600 hPa in 48 hours of GFS forecast
Storms
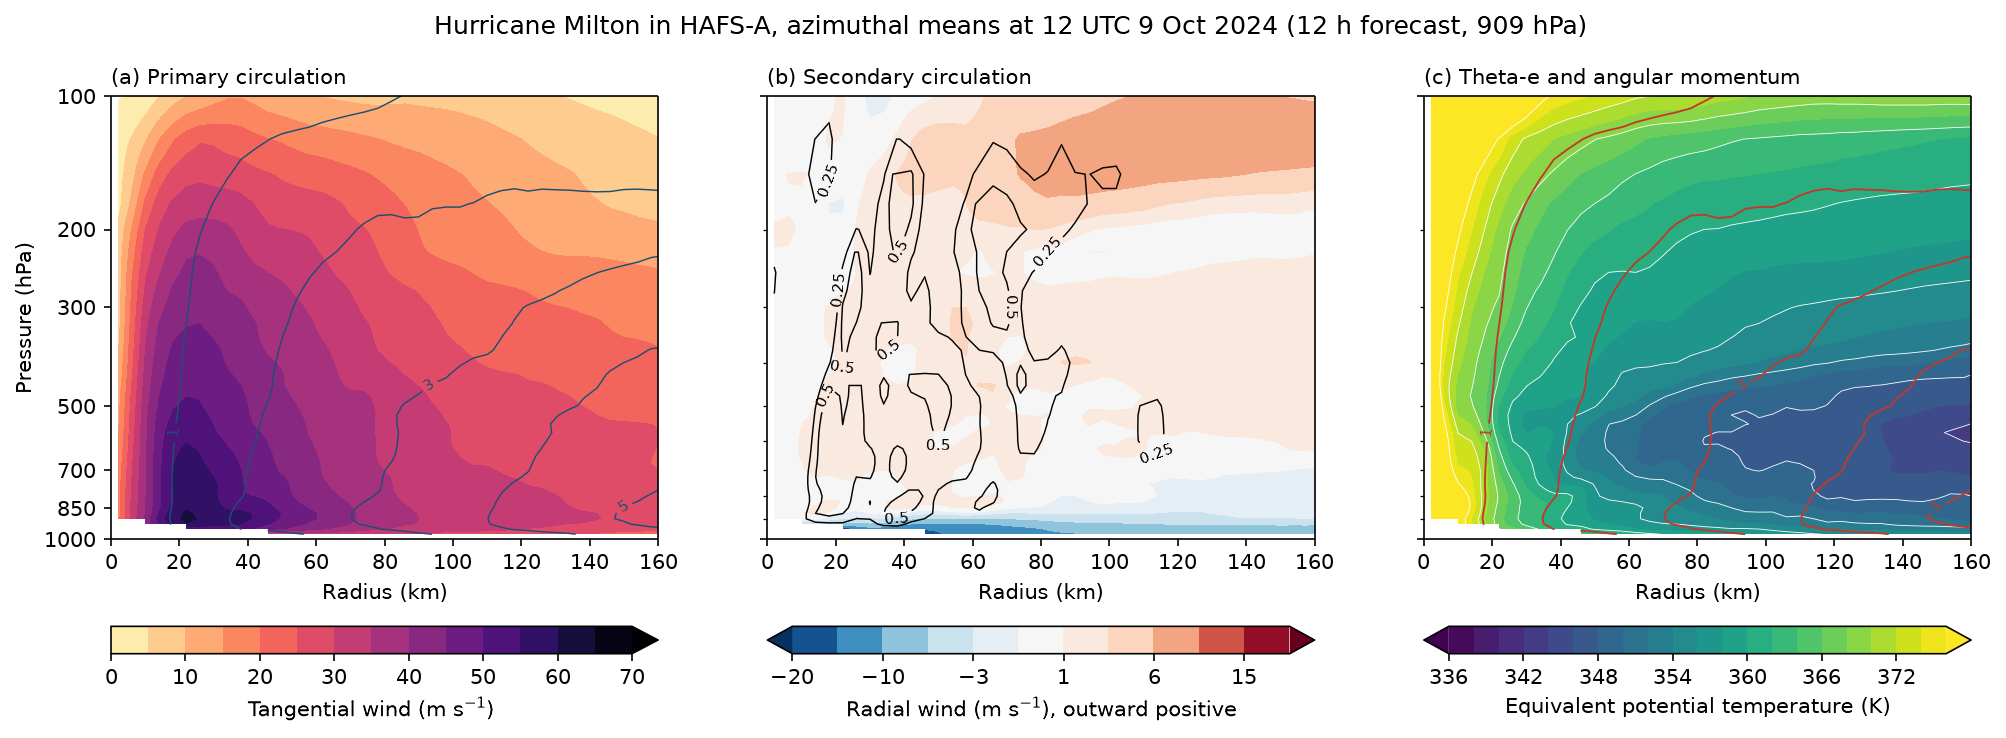
Hurricane vortex structureMilton in the 2 km HAFS-A storm nest
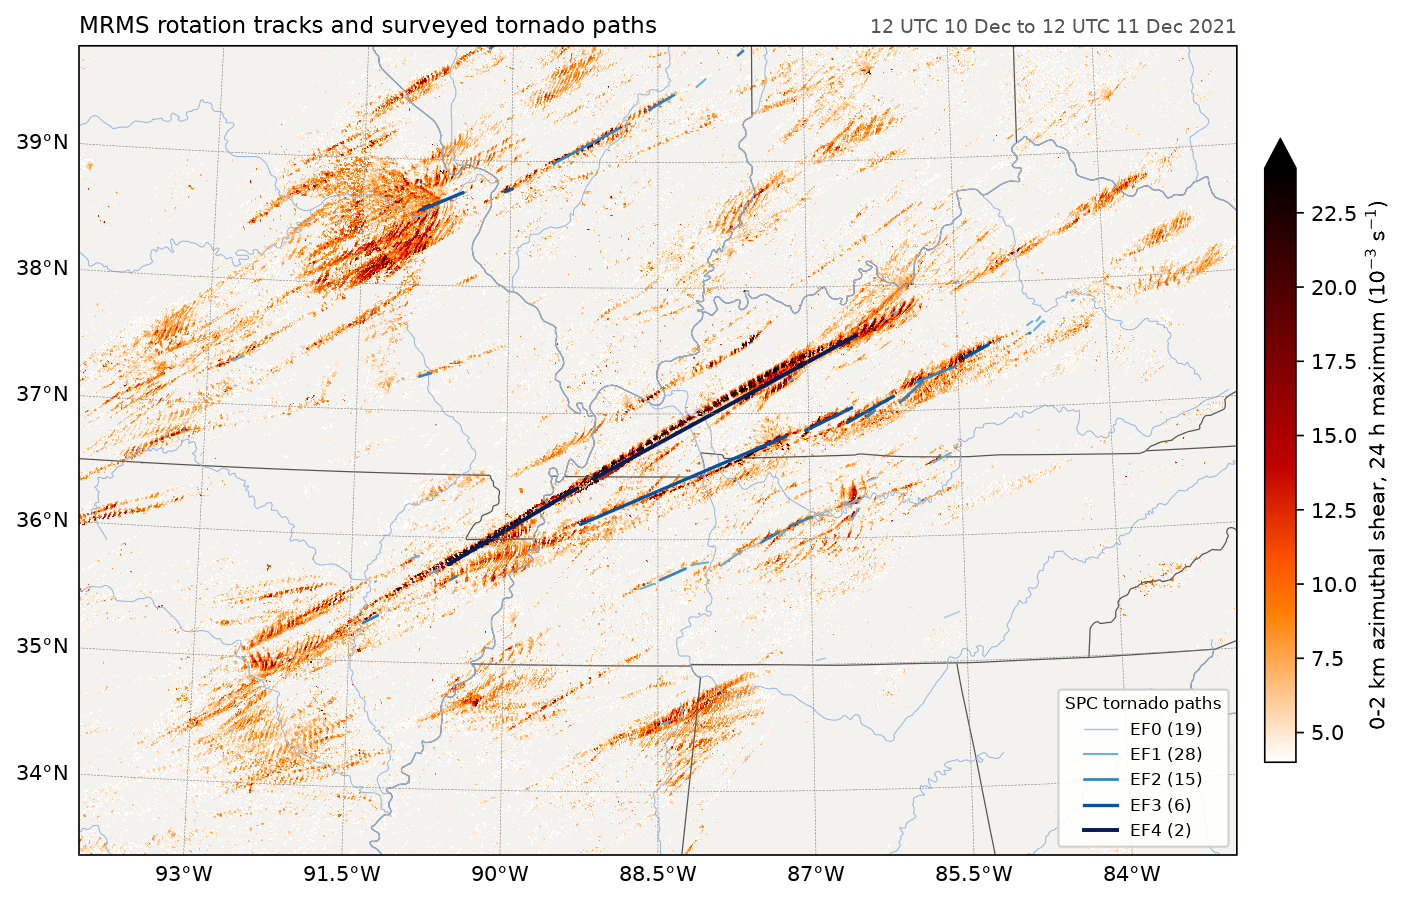
Rotation tracks and tornado pathsThe 10-11 December 2021 outbreak
Maps
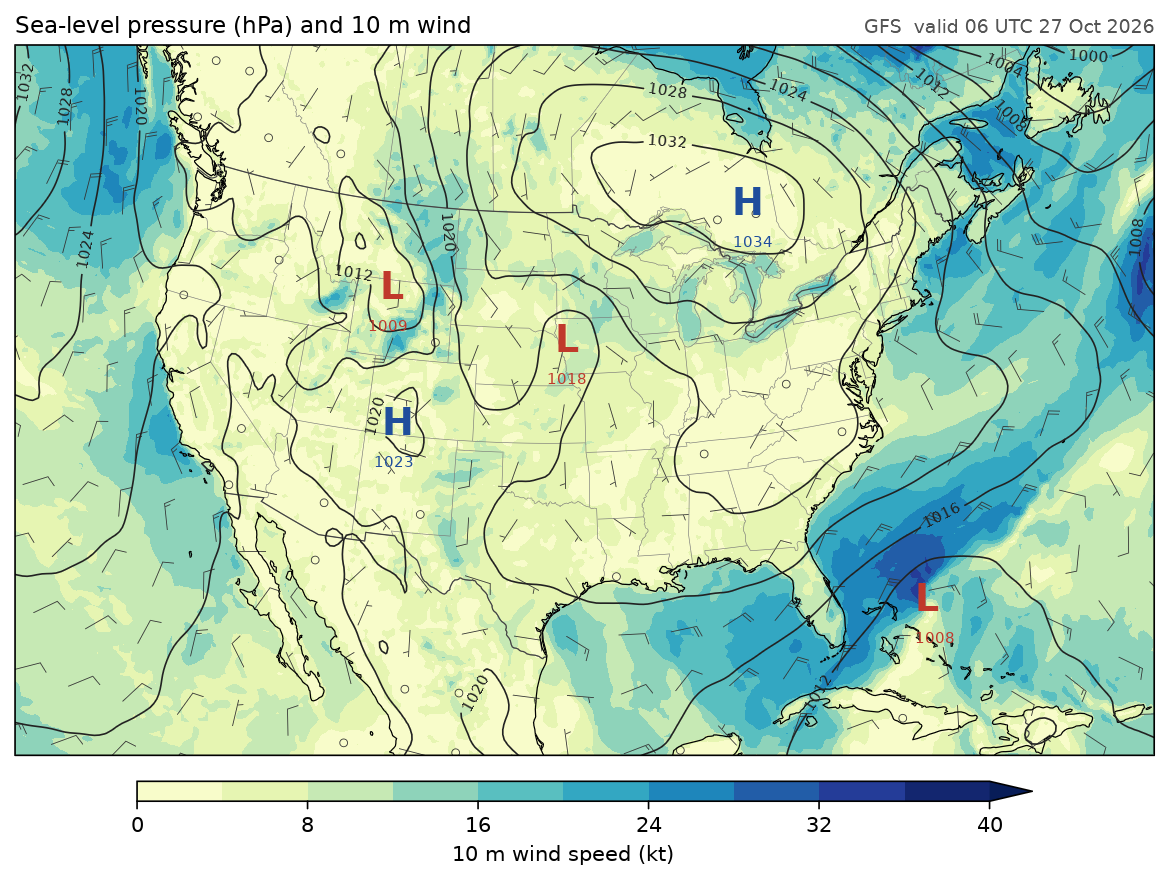
Surface analysisSea-level pressure and 10 m wind over North America
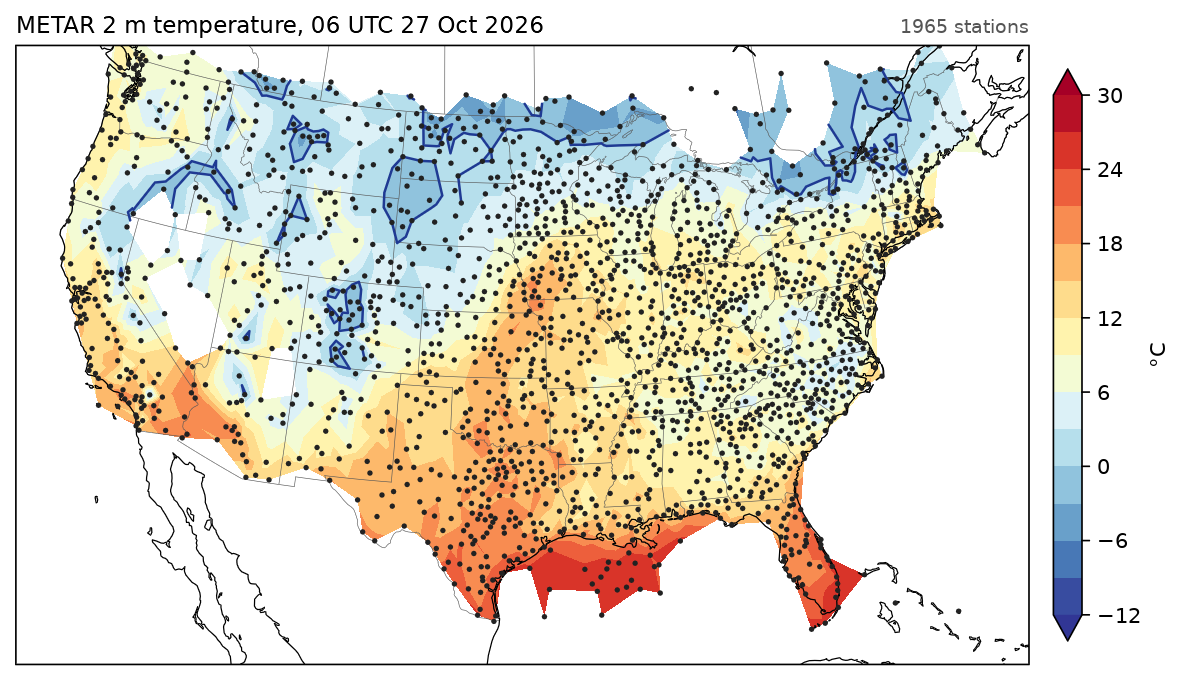
METAR temperature analysisTriangulated contours of 1,965 reports
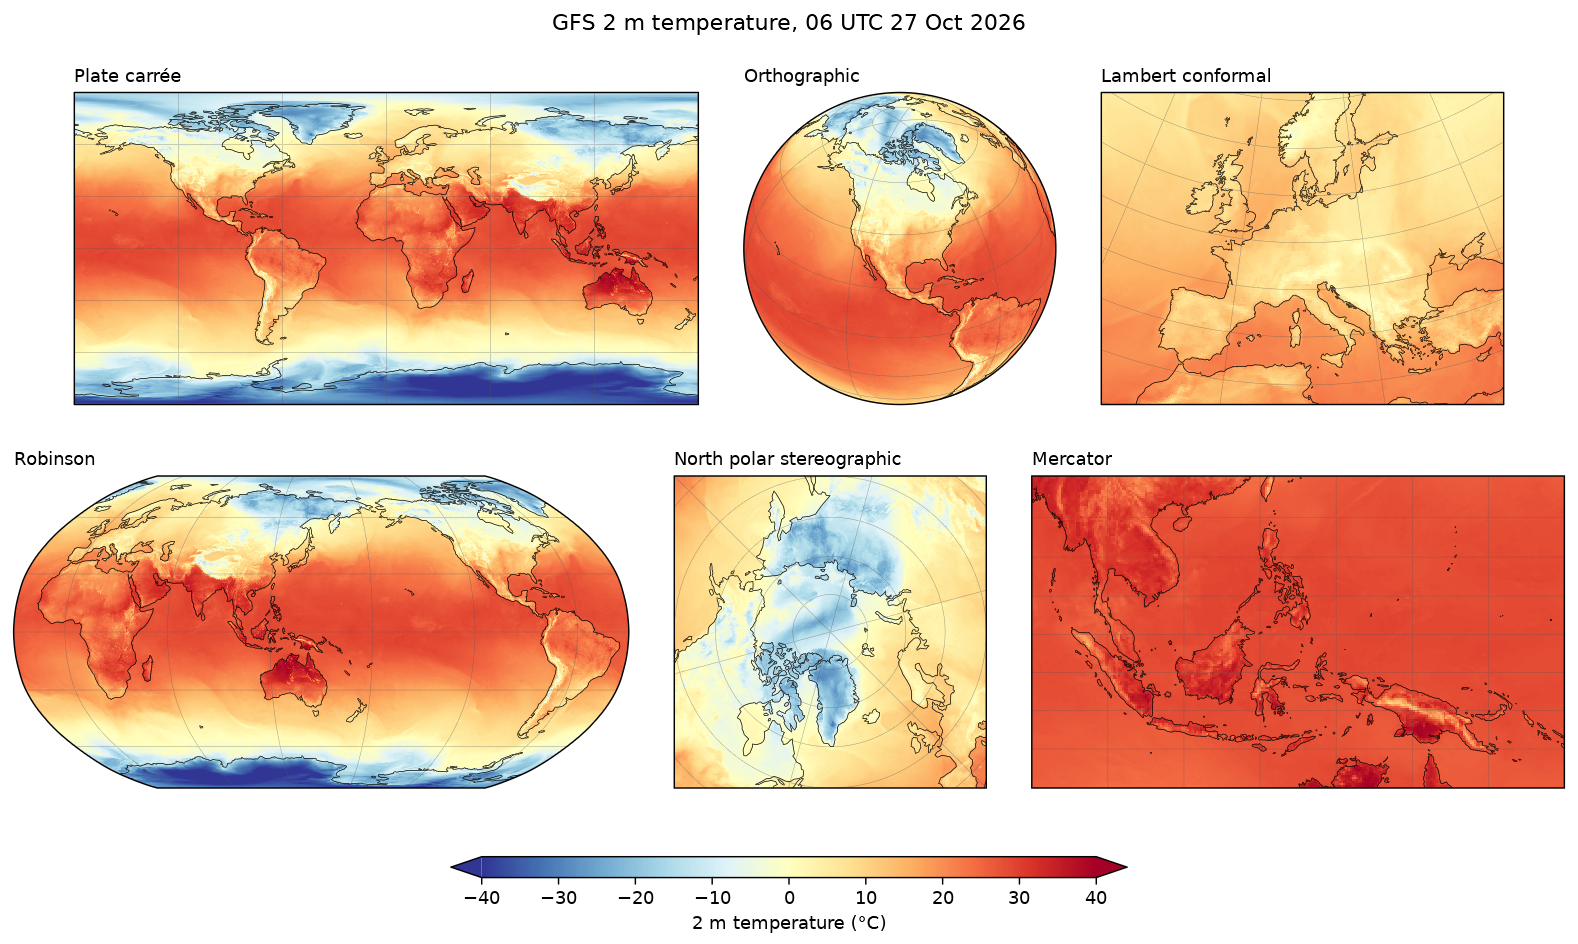
GFS 2 m temperature on six projectionsPlate carrée, orthographic, Lambert, Robinson, polar stereographic and Mercator