METAR temperature analysis
Temperature from every METAR report in the region at 06 UTC 27 October 2026, contoured on a Delaunay triangulation of the station positions with tricontourf. Triangles with a side longer than 2.5° are masked, so the analysis stops where the network does.
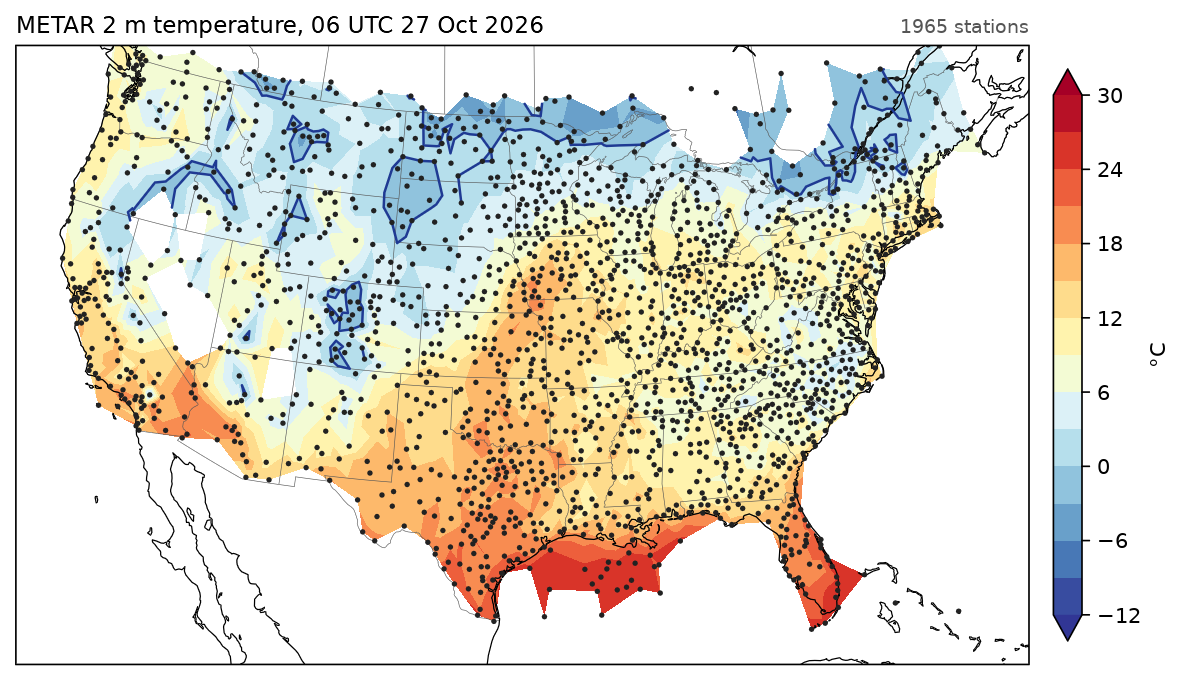
Data: aviationweather.gov, saved in docs/examples/data/metars_2026102706.csv.
docs/examples/station_analysis.py
"""Contouring scattered observations: 2 m temperature from every METAR report
in the region at 06 UTC 27 October 2026, analysed on a Delaunay triangulation
of the station positions. Triangles with a long side (over the oceans, past
the edge of the network) are masked out."""
import os

import numpy as np

import fastplot.crs as ccrs
import fastplot.feature as cfeature
import fastplot.pyplot as plt
import fastplot.tri as tri

HERE = os.path.dirname(os.path.abspath(__file__))
obs = np.genfromtxt(os.path.join(HERE, 'data', 'metars_2026102706.csv'), delimiter=',',
                    names=True, dtype=None, encoding='utf-8')
keep = (obs['lon'] > -126) & (obs['lon'] < -65) & (obs['lat'] > 23) & (obs['lat'] < 51)
lon, lat, temp = obs['lon'][keep], obs['lat'][keep], obs['temp_c'][keep]

stations = tri.Triangulation(lon, lat)
corners = np.stack([lon[stations.triangles], lat[stations.triangles]], axis=-1)
longest = np.hypot(*(corners - np.roll(corners, 1, axis=1)).transpose(2, 0, 1)).max(axis=1)
stations.set_mask(longest > 2.5)                    # degrees
data = ccrs.PlateCarree()

fig = plt.figure(figsize=(10.5, 6.6), dpi=150)
ax = fig.add_subplot(projection=ccrs.LambertConformal(central_longitude=-96, central_latitude=38))
ax.set_extent([-121, -71, 24, 50], crs=data)

filled = ax.tricontourf(stations, temp, levels=np.arange(-12, 31, 3), cmap='RdYlBu_r',
                        extend='both', transform=data)
ax.tricontour(stations, temp, levels=[0], colors='#1f3a93', linewidths=1.2, transform=data)
ax.scatter(lon, lat, s=1.2, color='#222222', transform=data, zorder=5)
ax.add_feature(cfeature.STATES, linewidth=0.3, edgecolor='#555555')
ax.coastlines(linewidth=0.6)

fig.colorbar(filled, ax=ax, shrink=0.75, pad=0.02, label='°C')
ax.set_title('METAR 2 m temperature, 06 UTC 27 Oct 2026', loc='left', fontsize=11)
ax.set_title('%d stations' % lon.size, loc='right', fontsize=9, color='#555555')

fig.savefig(os.path.join(HERE, '..', 'images', 'station_analysis.png'), bbox_inches='tight')