Benchmark chart
Milliseconds per field to decode every field of five operational files.
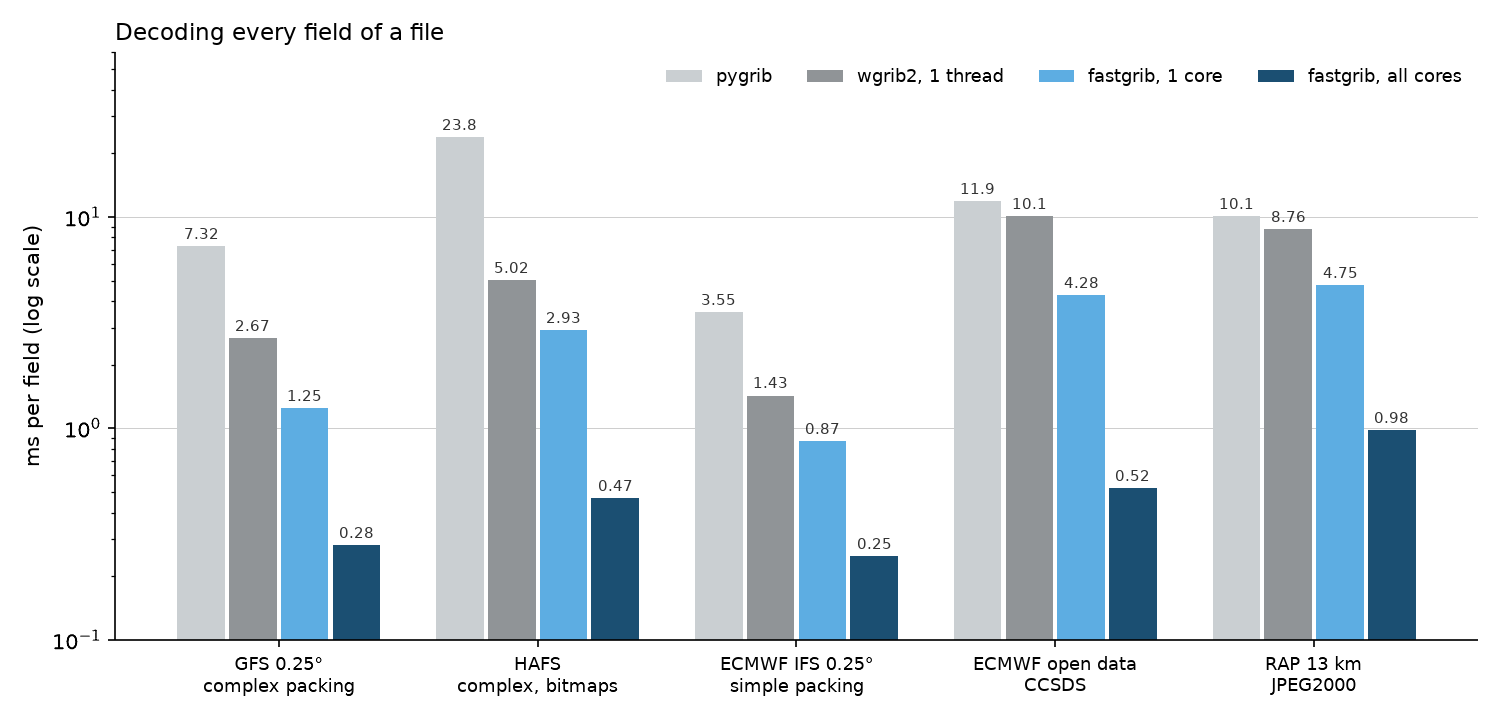
Data: the measurements on the performance page.
docs/examples/speed_chart.py
"""Milliseconds to decode one field, every field of each file in turn: pygrib,
wgrib2 and fastgrib (numbers from the README's table, measured on an
i7-13700K in WSL2). The chart is drawn with fastplot."""
import os

import numpy as np

import fastplot.pyplot as plt

files = ['GFS 0.25°\ncomplex packing', 'HAFS\ncomplex, bitmaps', 'ECMWF IFS 0.25°\nsimple packing',
         'ECMWF open data\nCCSDS', 'RAP 13 km\nJPEG2000']
times = {                                            # ms per field
    'pygrib': [7.32, 23.8, 3.55, 11.9, 10.1],
    'wgrib2, 1 thread': [2.67, 5.02, 1.43, 10.1, 8.76],
    'fastgrib, 1 core': [1.25, 2.93, 0.87, 4.28, 4.75],
    'fastgrib, all cores': [0.28, 0.47, 0.25, 0.52, 0.98],
}
colours = ['#cacfd2', '#909497', '#5dade2', '#1b4f72']

fig, ax = plt.subplots(figsize=(10, 4.8), dpi=150)
x = np.arange(len(files))
w = 0.2
for k, ((name, ms), colour) in enumerate(zip(times.items(), colours)):
    pos = x + (k - 1.5) * w
    ax.bar(pos, ms, width=w * 0.92, color=colour, label=name)
    for px, v in zip(pos, ms):
        ax.text(px, v * 1.08, ('%.2f' % v).rstrip('0').rstrip('.'), ha='center', fontsize=7,
                color='#333333')

ax.set_yscale('log')
ax.set_ylim(0.1, 60)
ax.set_xticks(x, files, fontsize=8.5)
ax.set_ylabel('ms per field (log scale)')
ax.spines['top'].set_visible(False)
ax.spines['right'].set_visible(False)
ax.grid(True, axis='y', linewidth=0.3)
ax.set_axisbelow(True)
ax.legend(loc='upper right', ncol=4, frameon=False, fontsize=8.5)
ax.set_title('Decoding every field of a file', loc='left', fontsize=11)
fig.tight_layout()

fig.savefig(os.path.join(os.path.dirname(os.path.abspath(__file__)), '..', 'images',
                         'speed_chart.png'))