Spherical harmonic synthesis
ECMWF's T63 surface temperature analysis, stored as 4,160 spherical-harmonic coefficients. wgrib2, ecCodes and pygrib return the coefficients; fastgrib can also synthesise the field at any points, here a 0.5° grid.
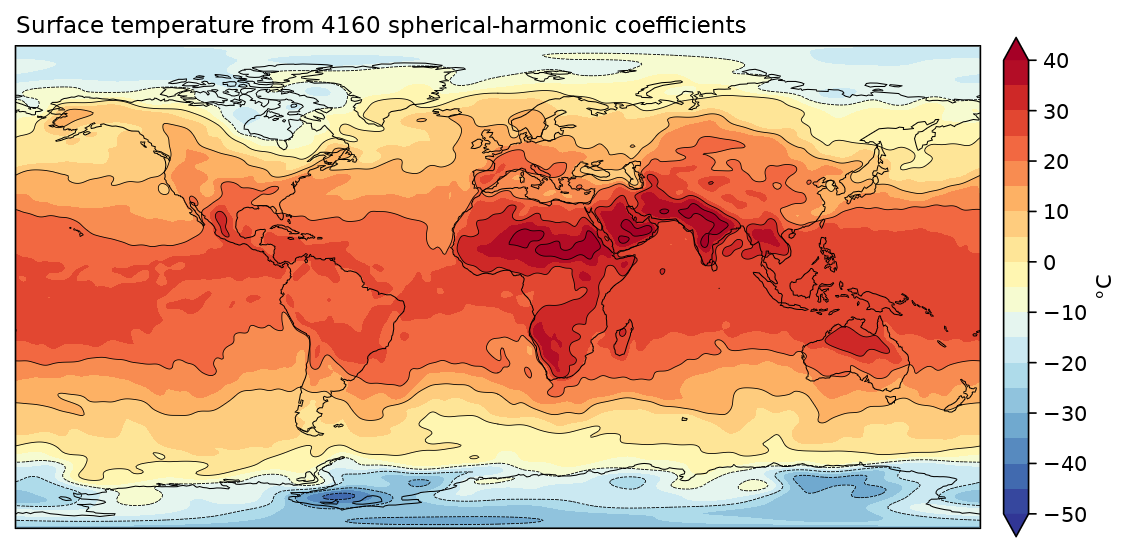
Data: ECMWF analysis for 12 UTC 24 April 2007, the sample ecCodes ships, in tests/data/sh.grb2.
docs/examples/spectral.py
"""A field stored as spherical harmonics (the spectral coefficients a global
model works in), turned into a map by fastgrib: wgrib2, ecCodes and pygrib
read the coefficients but do not synthesise the field."""
import os

import numpy as np

import fastgrib
import fastplot.crs as ccrs
import fastplot.pyplot as plt

HERE = os.path.dirname(os.path.abspath(__file__))
grib = fastgrib.open(os.path.join(HERE, '..', '..', 'tests', 'data', 'sh.grb2'))

coeffs = grib.read(0)                               # complex coefficients, as ecCodes gives them
lats = np.arange(-90, 90.01, 0.5)
lons = np.arange(0, 360, 0.5)
t = grib.regrid((lats, lons), 0) - 273.15           # synthesised on a 0.5 degree grid

fig = plt.figure(figsize=(10, 5.4), dpi=150)
ax = fig.add_subplot(projection=ccrs.PlateCarree())
filled = ax.contourf(lons, lats, t, levels=np.arange(-50, 41, 5), cmap='RdYlBu_r',
                     extend='both', transform=ccrs.PlateCarree())
ax.contour(lons, lats, t, levels=np.arange(-50, 41, 10), colors='k', linewidths=0.4,
           transform=ccrs.PlateCarree())
ax.coastlines(linewidth=0.5)
ax.set_global()
cb = fig.colorbar(filled, ax=ax, shrink=0.8, pad=0.02)
cb.set_label('°C')
ax.set_title('Surface temperature from %d spherical-harmonic coefficients' % coeffs.size,
             loc='left', fontsize=11)

fig.savefig(os.path.join(HERE, '..', 'images', 'spectral.png'), bbox_inches='tight')