Hovmöller diagram
The 250 hPa meridional wind averaged over 35-60°N, from 60 daily GFS analyses. Each analysis is a separate file in NOAA's archive, and fastgrib fetches the one field it needs from each; all 60 take about four seconds. Rossby wave packets show as bands of alternating colour sloping eastward with time, moving faster than the troughs and ridges inside them.
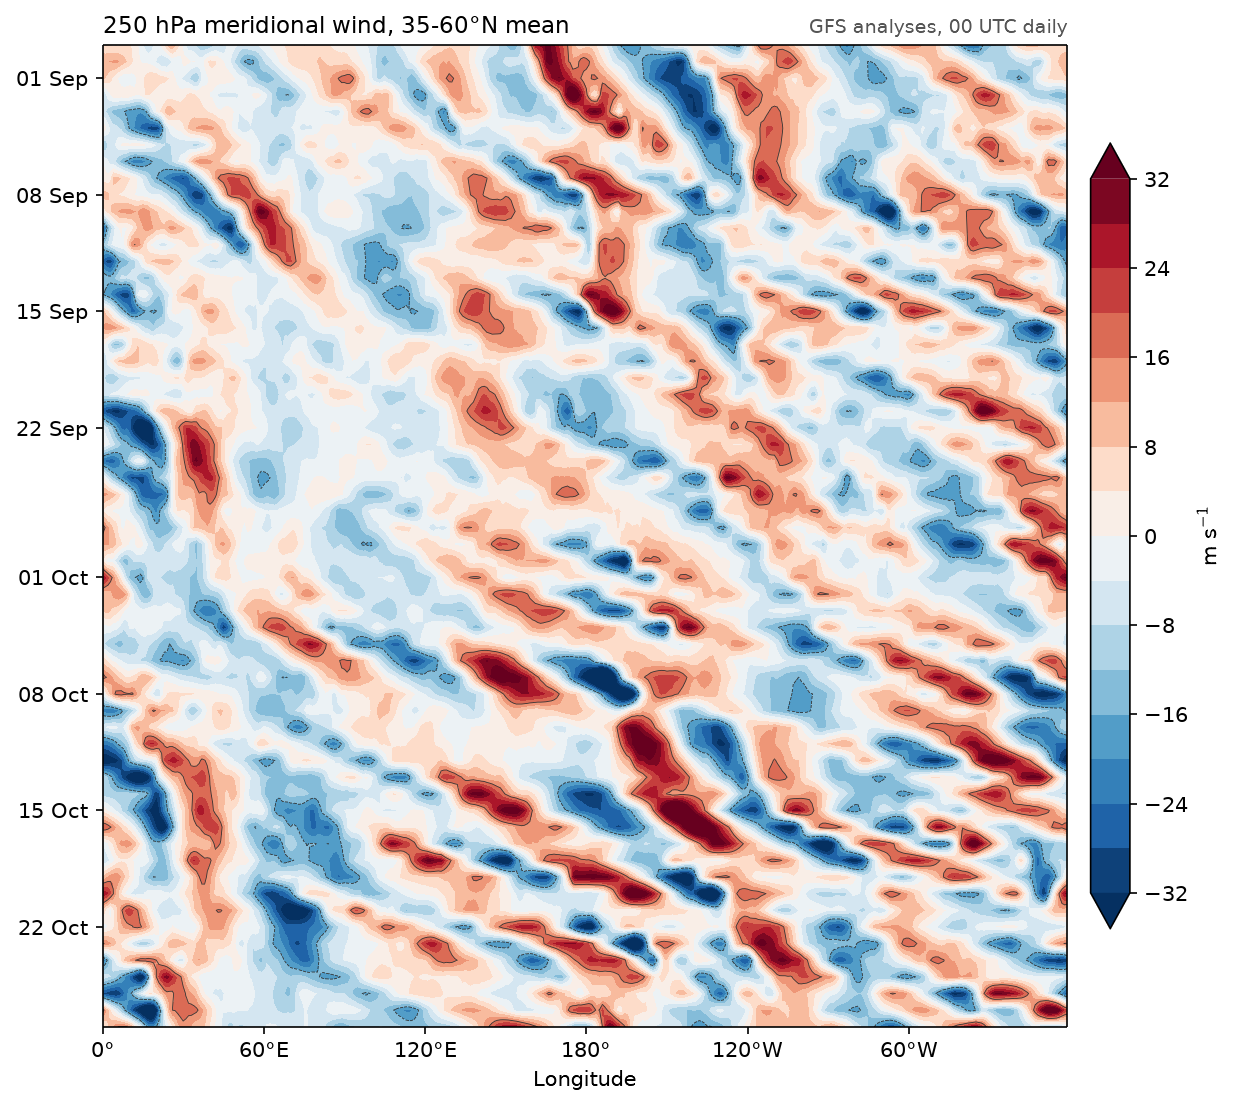
Data: GFS 1° analyses, 00 UTC, 30 August to 28 October 2026.
docs/examples/hovmoller.py
"""A Hovmöller diagram of the 250 hPa meridional wind, averaged over 35-60°N,
from 60 daily GFS analyses (00 UTC, 30 August to 28 October 2026). Each
analysis is a separate 1° file in NOAA's archive; fastgrib reads its index
and fetches the one field it needs. Rossby wave packets appear as bands of
alternating colour that slope eastward with time, faster than the troughs
and ridges inside them."""
import os
from concurrent.futures import ThreadPoolExecutor
from datetime import datetime, timedelta

import numpy as np

import fastgrib
import fastplot.dates as mdates
import fastplot.pyplot as plt

URL = 'https://noaa-gfs-bdp-pds.s3.amazonaws.com/gfs.{:%Y%m%d}/00/atmos/gfs.t00z.pgrb2.1p00.f000'
days = [datetime(2026, 8, 30) + timedelta(days=k) for k in range(60)]


def band_mean(day):
    grib = fastgrib.open(URL.format(day))
    v = grib.read('VGRD:250 mb')
    lat, lon = grib.latlon()
    rows = (lat[:, 0] >= 35) & (lat[:, 0] <= 60)
    return v[rows].mean(axis=0), lon[0]


with ThreadPoolExecutor(8) as pool:
    results = list(pool.map(band_mean, days))
v = np.array([r[0] for r in results])
lon = results[0][1]

fig, ax = plt.subplots(figsize=(10, 8.5), dpi=150)
filled = ax.contourf(lon, mdates.date2num(days), v, levels=np.arange(-32, 33, 4),
                     cmap='RdBu_r', extend='both')
ax.contour(lon, mdates.date2num(days), v, levels=[-16, 16], colors='#333333', linewidths=0.4)
ax.yaxis_date()
ax.invert_yaxis()
ax.yaxis.set_major_locator(mdates.DayLocator(bymonthday=[1, 8, 15, 22]))
ax.yaxis.set_major_formatter(mdates.DateFormatter('%d %b'))
ax.set_xticks(range(0, 361, 60), ['0°', '60°E', '120°E', '180°', '120°W', '60°W', '0°'])
ax.set_xlabel('Longitude')
fig.colorbar(filled, ax=ax, shrink=0.8, pad=0.02, label='m s$^{-1}$')
ax.set_title('250 hPa meridional wind, 35-60°N mean', loc='left', fontsize=11)
ax.set_title('GFS analyses, 00 UTC daily', loc='right', fontsize=9, color='#555555')

fig.savefig(os.path.join(os.path.dirname(os.path.abspath(__file__)), '..', 'images',
                         'hovmoller.png'), bbox_inches='tight')