Test-file grid outlines
The outline of each projected grid in fastgrib's test files, from the latitudes and longitudes fastgrib computes for it, with every 40th point of NAM's native rotated B-grid.
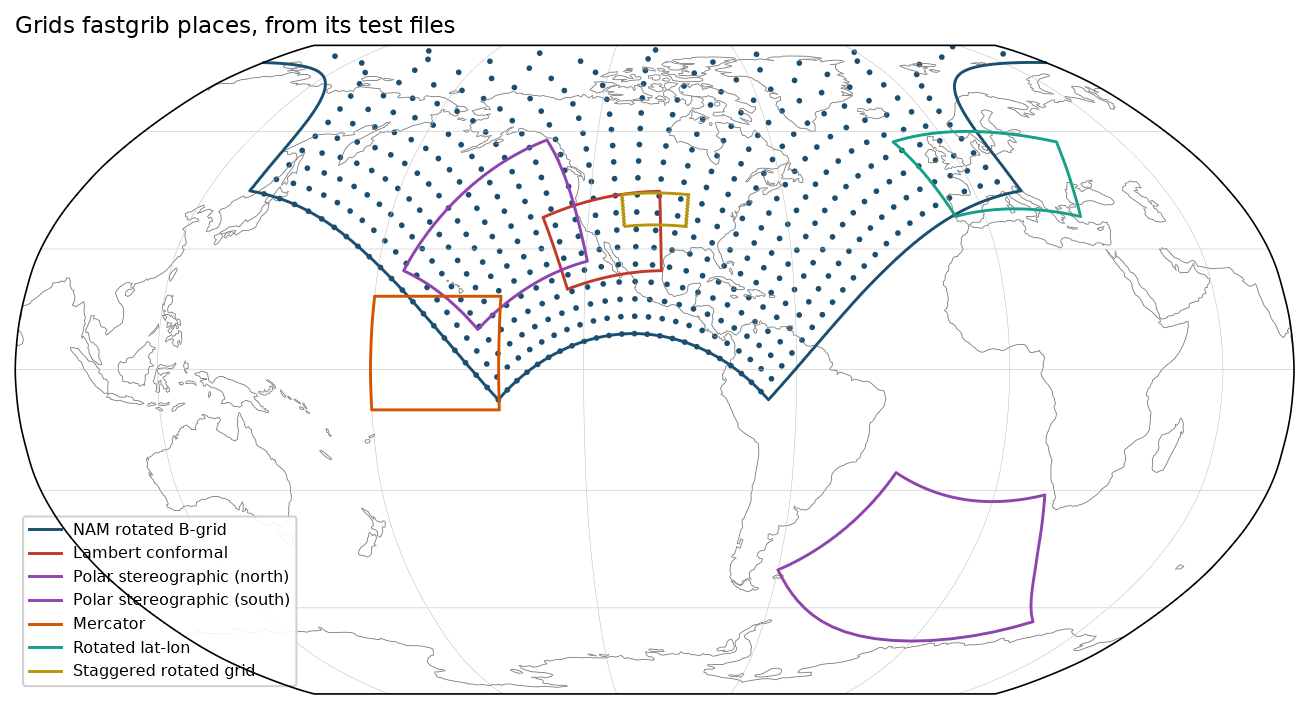
Data: tests/data/.
docs/examples/grids.py
"""Where fastgrib places the grids in its own test files: each grid's outline
on a world map, from the latitudes and longitudes fastgrib computes for it.
NAM's native rotated B-grid is shown by every 40th point of its lattice."""
import os

import numpy as np

import fastgrib
import fastplot.crs as ccrs
import fastplot.pyplot as plt

HERE = os.path.dirname(os.path.abspath(__file__))
DATA = os.path.join(HERE, '..', '..', 'tests', 'data')

grids = [                                            # file, label, colour
    ('nam_bgrd.grib2', 'NAM rotated B-grid', '#1b4f72'),
    ('lcc.grib2', 'Lambert conformal', '#c0392b'),
    ('nps.grib2', 'Polar stereographic (north)', '#8e44ad'),
    ('sps.grib2', 'Polar stereographic (south)', '#8e44ad'),
    ('merc.grib2', 'Mercator', '#d35400'),
    ('rot_ll.grib2', 'Rotated lat-lon', '#16a085'),
    ('stag.grib2', 'Staggered rotated grid', '#b7950b'),
]


def outline(lat, lon):
    """The edge of a 2-D grid, as one ring of points."""
    edge = [(lat[0], lon[0]), (lat[:, -1], lon[:, -1]), (lat[-1, ::-1], lon[-1, ::-1]),
            (lat[::-1, 0], lon[::-1, 0])]
    return np.concatenate([e[0] for e in edge]), np.concatenate([e[1] for e in edge])


fig = plt.figure(figsize=(11, 6.2), dpi=150)
ax = fig.add_subplot(projection=ccrs.Robinson(central_longitude=-100))
ax.set_global()
ax.coastlines(linewidth=0.4, color='#777777')
ax.gridlines(linewidth=0.25, color='#bbbbbb')
geo = ccrs.Geodetic()

for name, label, colour in grids:
    f = fastgrib.open(os.path.join(DATA, name))
    lat, lon = f.latlon(0)
    if name == 'nam_bgrd.grib2':
        ax.scatter(lon[::40, ::40], lat[::40, ::40], s=1.5, color=colour, transform=geo)
    ylat, ylon = outline(lat, lon)
    ax.plot(ylon, ylat, color=colour, linewidth=1.4, transform=geo, label=label)

ax.legend(loc='lower left', fontsize=7.5, frameon=True, framealpha=0.9)
ax.set_title('Grids fastgrib places, from its test files', loc='left', fontsize=11)

fig.savefig(os.path.join(HERE, '..', 'images', 'grids.png'), bbox_inches='tight')