GFS and ECMWF verification
The 500 hPa height forecasts of GFS and ECMWF's IFS from 18 daily runs, each scored against its own model's analysis at every 24 hours of lead time. Panel (a) is the latitude-weighted RMSE over 20-90°N for each run and on average; panel (b) is where GFS's day-5 errors were larger (red) or smaller (blue) than IFS's. The two models come from two centres' archives; fastgrib fetches about 450 fields, one per file, in about 20 seconds.
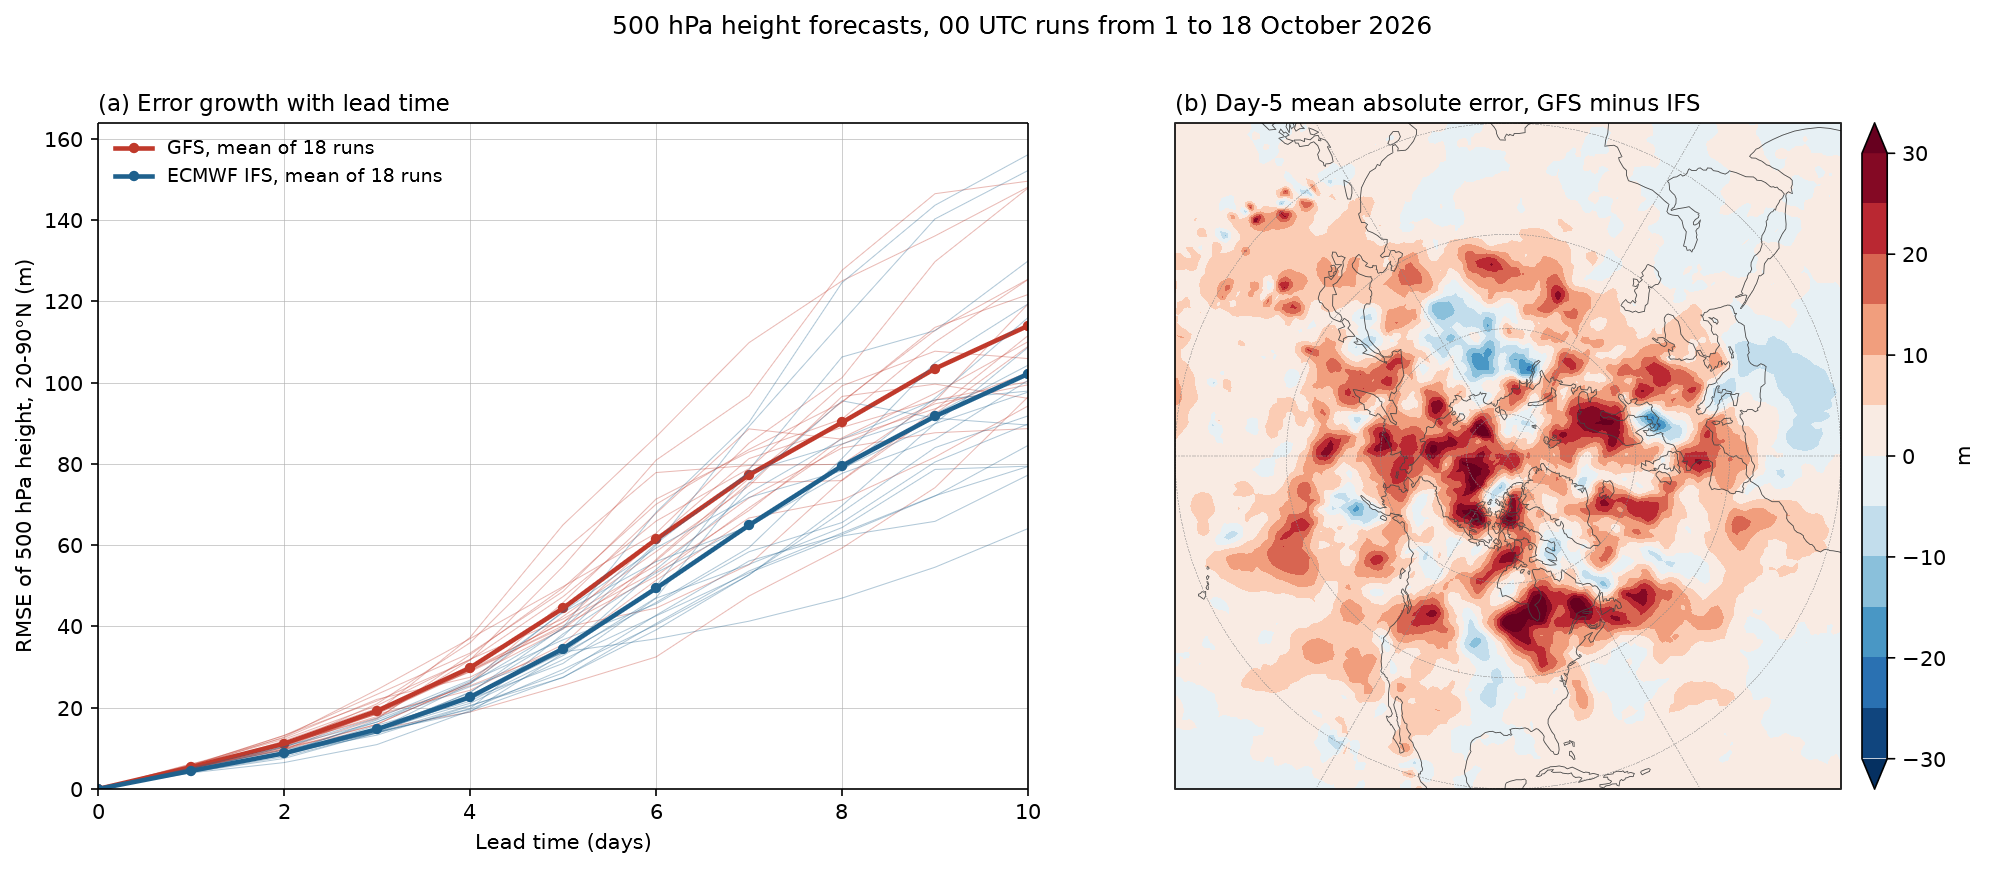
Data: GFS 1° from NOAA's archive and IFS 0.25° open data (CC BY 4.0) from ECMWF's Google Cloud mirror, 00 UTC runs from 1 to 18 October 2026.
docs/examples/model_verification.py
"""GFS and ECMWF IFS 500 hPa height forecasts verified over 18 days of runs
(00 UTC, 1 to 18 October 2026), each against its own model's analysis.

(a) Root-mean-square error over 20-90°N, weighted by the cosine of latitude,
    for every run (thin lines) and averaged over the runs (thick), as a
    function of lead time.
(b) The mean absolute day-5 error of GFS minus that of IFS at each point:
    red where GFS's forecasts were worse, blue where IFS's were.

GFS comes from NOAA's archive (1° files) and IFS from ECMWF's open data
mirror on Google Cloud (0.25°, taken every fourth point to the same 1° grid). Each
forecast is a separate file; fastgrib reads its index and fetches the one
500 hPa height field, about 450 fields from two centres in all.
"""
import os
from concurrent.futures import ThreadPoolExecutor
from datetime import datetime, timedelta

import numpy as np

import fastgrib
import fastplot.crs as ccrs
import fastplot.pyplot as plt

GFS = ('https://noaa-gfs-bdp-pds.s3.amazonaws.com/gfs.{:%Y%m%d}/00/atmos/'
       'gfs.t00z.pgrb2.1p00.f{:03d}')
IFS = ('https://storage.googleapis.com/ecmwf-open-data/{0:%Y%m%d}/00z/ifs/0p25/oper/'
       '{0:%Y%m%d}000000-{1}h-oper-fc.grib2')
runs = [datetime(2026, 10, 1) + timedelta(days=k) for k in range(18)]
leads = list(range(0, 241, 24))


def gfs(run, lead):
    return fastgrib.open(GFS.format(run, lead)).read('HGT:500 mb').astype(np.float64)


def ifs(run, lead):
    grib = fastgrib.open(IFS.format(run, lead))
    rec = grib.select(short_name='gh', level_value=500)[0]
    z = grib.read(rec)[::4, ::4].astype(np.float64)                  # 0.25° to 1°
    lon = grib.latlon(rec)[1][0, ::4]
    return z[:, np.argsort(lon % 360)]                               # 0..359°E, as GFS


jobs = [(m, run, lead) for m in ('gfs', 'ifs') for run in runs for lead in leads]
analyses = sorted({run + timedelta(hours=lead) for run in runs for lead in leads})
jobs += [(m, day, 0) for m in ('gfs', 'ifs') for day in analyses if day not in runs]
with ThreadPoolExecutor(8) as pool:
    fields = dict(zip(jobs, pool.map(lambda j: (gfs if j[0] == 'gfs' else ifs)(j[1], j[2]),
                                     jobs)))

lat = np.arange(-90, 90.5, 1.0)
north = lat >= 20
weight = np.cos(np.radians(lat[north]))[:, None] * np.ones(360)[None]
rmse = {m: np.zeros((len(runs), len(leads))) for m in ('gfs', 'ifs')}
day5 = {m: [] for m in ('gfs', 'ifs')}
for m in ('gfs', 'ifs'):
    for i, run in enumerate(runs):
        for j, lead in enumerate(leads):
            truth = fields[(m, run + timedelta(hours=lead), 0)]
            err = fields[(m, run, lead)] - truth
            rmse[m][i, j] = np.sqrt((err[north] ** 2 * weight).sum() / weight.sum())
            if lead == 120:
                day5[m].append(np.abs(err))
diff = np.mean(day5['gfs'], axis=0) - np.mean(day5['ifs'], axis=0)

W, H = 14.0, 6.0                                             # inches
bottom, height = 0.12, 0.74                                  # both panels the same height
fig = plt.figure(figsize=(W, H), dpi=150)
proj = ccrs.NorthPolarStereo(central_longitude=-90)
side = height * H / W                                        # the polar map is square

ax = fig.add_axes((0.06, bottom, 0.94 - side - 0.12 - 0.06, height))
days = np.array(leads) / 24
for m, colour, label in (('gfs', '#c0392b', 'GFS'), ('ifs', '#1f618d', 'ECMWF IFS')):
    for row in rmse[m]:
        ax.plot(days, row, color=colour, linewidth=0.5, alpha=0.35)
    ax.plot(days, rmse[m].mean(axis=0), 'o-', color=colour, linewidth=2.2, markersize=4,
            label='%s, mean of %d runs' % (label, len(runs)))
ax.set_xlabel('Lead time (days)')
ax.set_ylabel('RMSE of 500 hPa height, 20-90°N (m)')
ax.set_xlim(0, 10)
ax.set_ylim(0, None)
ax.grid(True, linewidth=0.3)
ax.legend(loc='upper left', frameon=False, fontsize=9)
ax.set_title('(a) Error growth with lead time', loc='left', fontsize=11)

ax = fig.add_axes((0.94 - side - 0.05, bottom, side, height), projection=proj)
ax.set_extent([-180, 180, 20, 90], crs=ccrs.PlateCarree())
filled = ax.contourf(np.arange(0, 360, 1.0), lat, diff, levels=np.arange(-30, 31, 5),
                     cmap='RdBu_r', extend='both', transform=ccrs.PlateCarree())
ax.coastlines(linewidth=0.4, color='#444444')
ax.gridlines(linewidth=0.25, color='#888888', linestyle='--')
fig.colorbar(filled, cax=fig.add_axes((0.94 - 0.04, bottom, 0.012, height)), label='m')
ax.set_title('(b) Day-5 mean absolute error, GFS minus IFS', loc='left', fontsize=11)

fig.suptitle('500 hPa height forecasts, 00 UTC runs from 1 to 18 October 2026', fontsize=12)
fig.savefig(os.path.join(os.path.dirname(os.path.abspath(__file__)), '..', 'images',
                         'model_verification.png'), bbox_inches='tight')